Welcome to this beautifully kept, convenient, high-value, well-crafted and perfect starter family home nestled in the sought-after Marpole community. Features 5 bedrooms + 5 bathrooms, with 4 bedrooms upstairs and a 1-bedroom suite in the basement with a private entrance, ideal as a potential mortgage helper! Master bedroom includes a jacuzzi ensuite, plus…
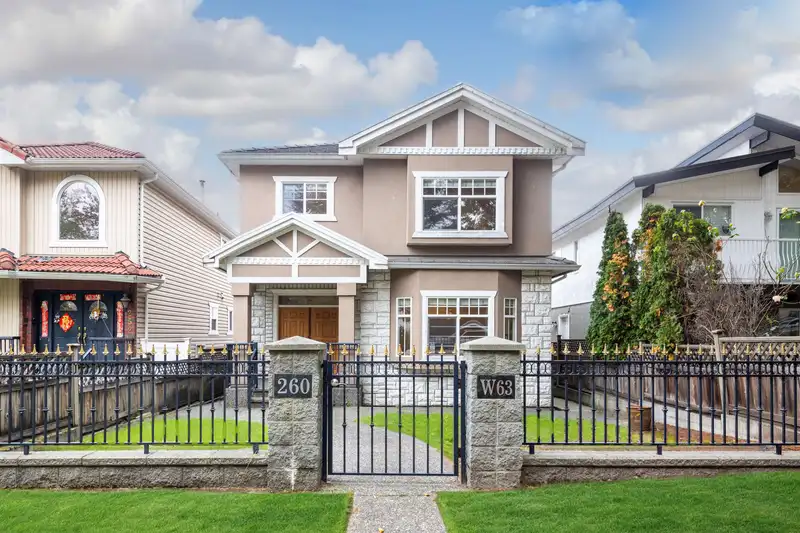
Welcome to this beautifully kept, convenient, high-value, well-crafted and perfect starter family home nestled in the sought-after Marpole community. Features 5 bedrooms + 5 bathrooms, with 4 bedrooms upstairs and a 1-bedroom suite in the basement with a private entrance, ideal as a potential mortgage helper! Master bedroom includes a jacuzzi ensuite, plus elegant Living, Dining & Family areas. Equipped with radiant floor heating, quality hardwood flooring and cabinetry. Thoughtfully designed layout with a bright south-facing family room. Walking distance to top-ranked Churchill (French Immersion), Ideal Mini School, J.W. Sexsmith, parks, Oakridge Mall, Community Centre, T&T , and Skytrain - offering easy access to Richmond & Downtown.
Features
Private Yard
Garage Double
Front Access
Lane Access
Asphalt
Shopping Nearby
Room measurements11 rooms▸
Living RoomMain · 11'11 × 14'2
KitchenMain · 9'5 × 10'8
Dining RoomMain · 9'7 × 15'7
Family RoomMain · 15'3 × 13'11
NookMain · 3'5 × 10'8
BedroomAbove · 8'8 × 10'1
BedroomAbove · 8'9 × 10'11
BedroomAbove · 12'5 × 10'11
Primary BedroomAbove · 13'6 × 14'4
Recreation RoomBsmt · 11'8 × 13'8
BedroomBsmt · 11'3 × 8'11
Floor plan
🔍 Tap to zoom
Pinch or scroll to zoom · drag to pan · double-tap to reset
Property Details
MLS NumberR3126093
Property TypeSingle Family Residence
Bedrooms5
Bathrooms4.5
Square Feet2,523
Lot Size3,895 sqft
Year Built2003
Parking Spaces2
HeatingRadiant
StatusClosed
Listed ByRoyal Pacific Realty Corp.
School Catchment
ElementarySexsmith
SecondaryChurchill
Neighbourhood
Highlighted area = this home's census tract (StatCan), the boundary the neighbourhood stats describe.
$1,340,000Median home value
$69,500Median household income
49.4%Owner-occupied
15.1%Single-detached homes
2.2Avg household size
35.6Median age
57.4%Bachelor's degree or higher (25-64)
59.5%Commute under 30 min
60.6%Drive to work
53.1%Foreign-born residents
7,090Neighbourhood population
Age
Under 1510%
15 to 6473.4%
65 and over16.6%
Household size
1 person36.2%
234.2%
313.8%
49.7%
5 or more6.2%
Language spoken at home
27.6% English mother tongue
Cantonese20.1%
Mandarin19.8%
English + other5.7%
Tagalog3.8%
Punjabi3.1%
Korean3%
All others16.9%
Mother tongue, share of 6,930 residents.
How this pocket differs
notably more Punjabi speakers than Marpole 3.1% vs 1.6%
notably more Korean speakers than Marpole 3% vs 1.7%
more Mandarin speakers than Marpole 19.8% vs 15.6%
more Cantonese speakers than Marpole 20.1% vs 16.4%
Median household income is lower than Metro Vancouver $69,500 vs $90,000
Median dwelling value is higher than Metro Vancouver $1,340,000 vs $1,050,000
Source: Statistics Canada, Census of Population, 2021. Reproduced and distributed on an "as is" basis with the permission of Statistics Canada.
Land & Development
Lot size3,896 sqft
Lot dimensions34 × 115 ft
Lot shapeRectangular
Transit-oriented potential (Bill 47 / TOA)
Transit areaTier 3within 800 m of a station
Max density3 FAR
Max height8 storeys
Est. buildable~11,649 sqft
Nearest stationMarine Drive Station479 m away
Within a provincially designated Transit-Oriented Area, this lot may support up to 3 FAR / 8 storeys regardless of base zoning. Provincial minimums and approximate — municipal rezoning, servicing and parking standards still apply.
Approximate lot lines (ParcelMap BC)
Zoning, lot dimensions and grade are approximate, from public data, and for reference only — verify with the City / Township of Langley before relying on them.
Recent nearby sales
Sold prices are available to registered users. Log in to see what these sold for.

 1 / 1 photos