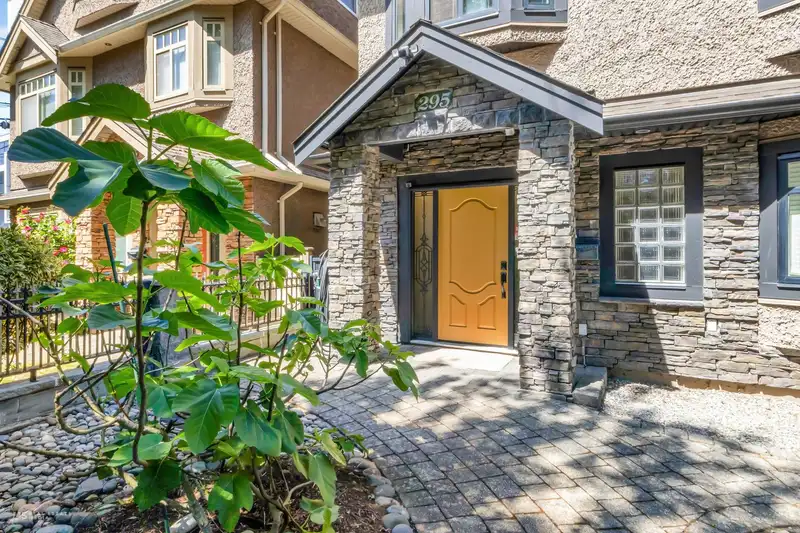
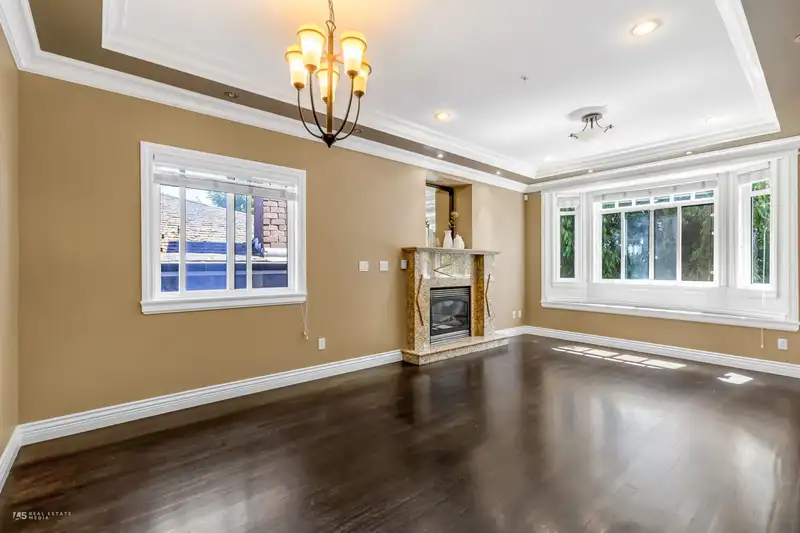
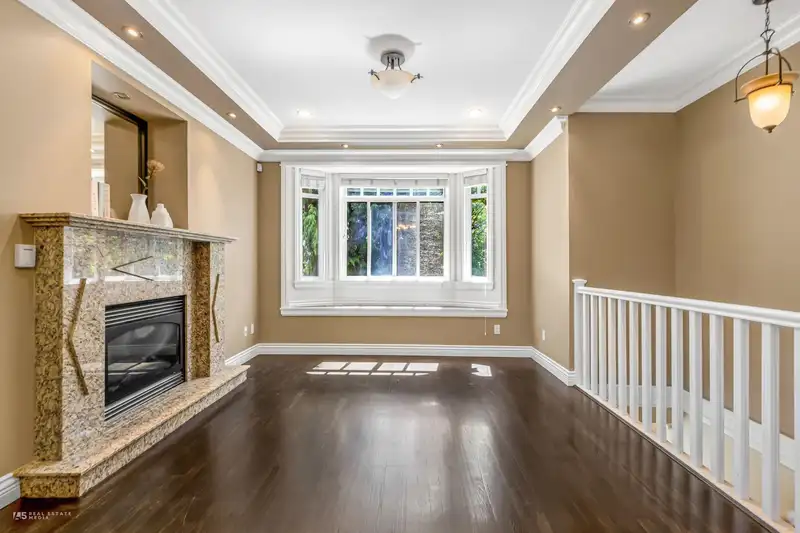
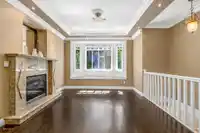
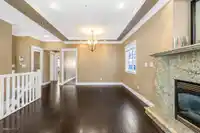
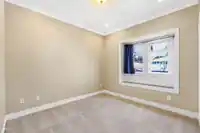
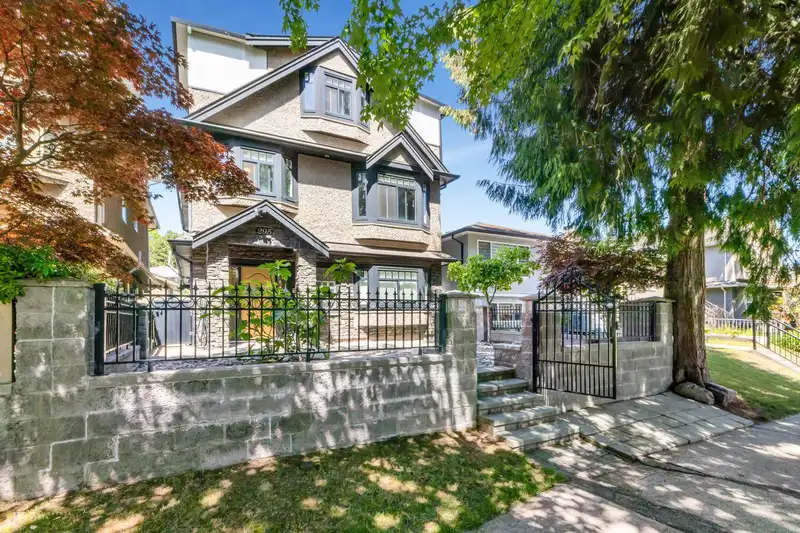
Situated in the highly sought-after Marpole neighbourhood, this well-maintained 6-bedroom, 4-bathroom detached home offers comfortable family living and strong income potential with two self-contained suites. Freshly updated with new paint and refreshed cabinetry, it also features EV charging and a tankless hot water on-demand system for added efficiency…
Situated in the highly sought-after Marpole neighbourhood, this well-maintained 6-bedroom, 4-bathroom detached home offers comfortable family living and strong income potential with two self-contained suites. Freshly updated with new paint and refreshed cabinetry, it also features EV charging and a tankless hot water on-demand system for added efficiency and convenience. Just steps from Marine Gateway, enjoy easy access to shopping, dining, entertainment, and transit, with seamless connections to Downtown Vancouver, Richmond, Burnaby, Langara College, and the vibrant Oakridge Park district. Located within the prestigious Sir Winston Churchill Secondary School catchment, this home offers both family comfort and excellent income potential.
Features
Balcony
Detached
Garage Double
Lane Access
Side Access
Garage Door Opener
Room measurements14 rooms▸
Living RoomMain · 12'3 × 11'6
KitchenMain · 16'6 × 12'3
Dining RoomMain · 7'9 × 11'10
BedroomMain · 11'11 × 9'2
BedroomMain · 11'1 × 11'8
Primary BedroomAbove · 16'8 × 11'8
SolariumAbv Main 2 · 15'1 × 24'2
SolariumAbv Main 2 · 20'4 × 5'8
FoyerBelow · 10'11 × 10'0
BedroomBelow · 8'4 × 11'6
BedroomBelow · 8' × 8'
KitchenBelow · 11'8 × 11'9
BedroomBelow · 8'8 × 12'4
Recreation RoomBelow · 10'5 × 12'
Floor plan
🔍 Tap to zoom
Pinch or scroll to zoom · drag to pan · double-tap to reset
Property Details
MLS NumberR3130279
Property TypeSingle Family Residence
Bedrooms6
Bathrooms4
Square Feet2,990
Lot Size3,610 sqft
Year Built2009
Parking Spaces2
HeatingNatural Gas, Radiant
Days on Market82
StatusActive
Listed ByRoyal Pacific Realty Corp.
School Catchment
ElementarySexsmith
SecondaryChurchill
Neighbourhood
Highlighted area = this home's census tract (StatCan), the boundary the neighbourhood stats describe.
$1,340,000Median home value
$69,500Median household income
49.4%Owner-occupied
15.1%Single-detached homes
2.2Avg household size
35.6Median age
57.4%Bachelor's degree or higher (25-64)
59.5%Commute under 30 min
60.6%Drive to work
53.1%Foreign-born residents
7,090Neighbourhood population
Age
Under 1510%
15 to 6473.4%
65 and over16.6%
Household size
1 person36.2%
234.2%
313.8%
49.7%
5 or more6.2%
Language spoken at home
27.6% English mother tongue
Cantonese20.1%
Mandarin19.8%
English + other5.7%
Tagalog3.8%
Punjabi3.1%
Korean3%
All others16.9%
Mother tongue, share of 6,930 residents.
How this pocket differs
notably more Punjabi speakers than Marpole 3.1% vs 1.6%
notably more Korean speakers than Marpole 3% vs 1.7%
more Mandarin speakers than Marpole 19.8% vs 15.6%
more Cantonese speakers than Marpole 20.1% vs 16.4%
Median household income is lower than Metro Vancouver $69,500 vs $90,000
Median dwelling value is higher than Metro Vancouver $1,340,000 vs $1,050,000
Source: Statistics Canada, Census of Population, 2021. Reproduced and distributed on an "as is" basis with the permission of Statistics Canada.
Land & Development
Lot size3,615 sqft
Lot dimensions31 × 115 ft
Lot shapeRectangular
Transit-oriented potential (Bill 47 / TOA)
Transit areaTier 3within 800 m of a station
Max density3 FAR
Max height8 storeys
Est. buildable~10,811 sqft
Nearest stationMarine Drive Station470 m away
Within a provincially designated Transit-Oriented Area, this lot may support up to 3 FAR / 8 storeys regardless of base zoning. Provincial minimums and approximate — municipal rezoning, servicing and parking standards still apply.
Approximate lot lines (ParcelMap BC)
Zoning, lot dimensions and grade are approximate, from public data, and for reference only — verify with the City / Township of Langley before relying on them.
Monthly Cost Calculator
Estimated monthly cost$12,449
Mortgage payment$11,351
Property tax$849
Home insurance$250
Partner Rates Available
Contact us for preferred mortgage rates
Monthly cost
Estimated monthly$12,449
$2,108,000$2,868,000
20%50%
2.80%6.80%
5 years30 years
$8,083/yr$12,283/yr
$200/mo$300/mo
An estimate only. Canadian semi-annual compounding; excludes utilities, closing costs and BC property transfer tax.
5-year fixed, as of Aug 19

 1 / 25 photos