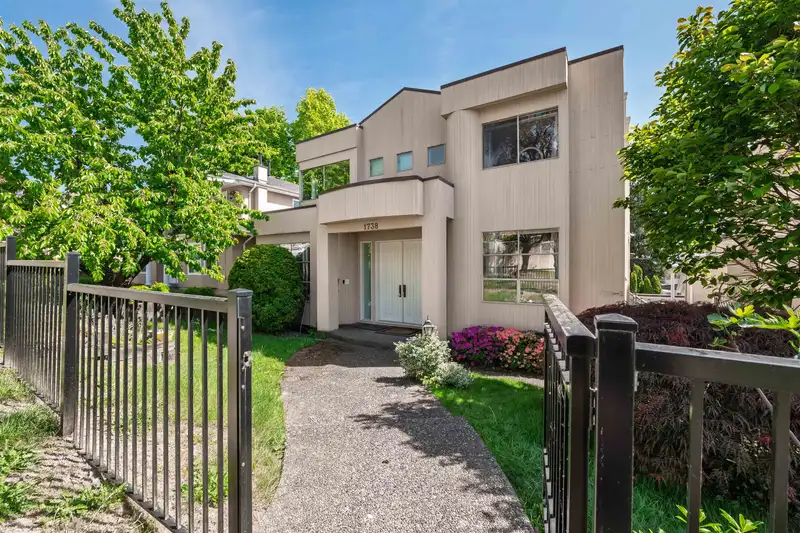
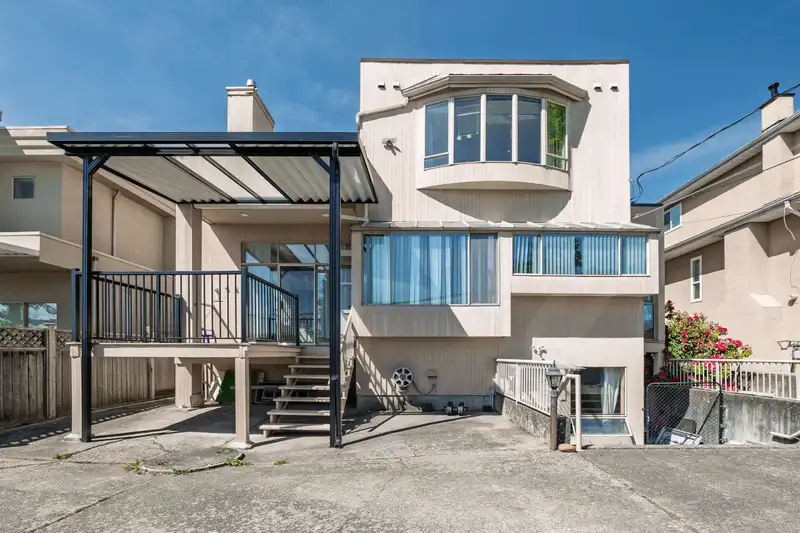
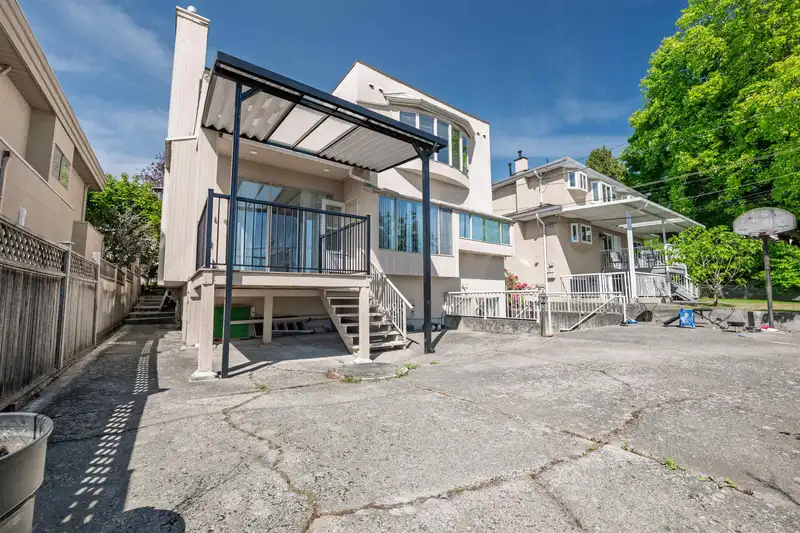
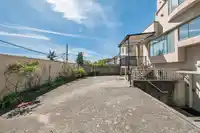
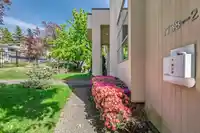
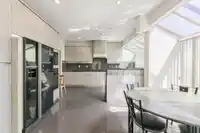
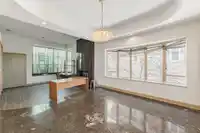
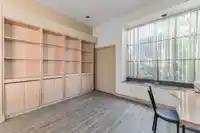
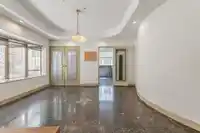
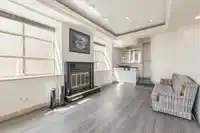
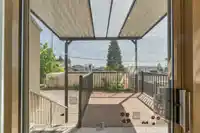
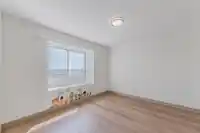
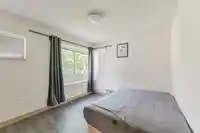
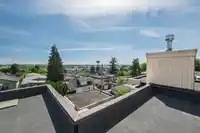
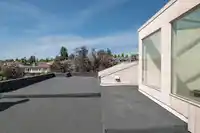
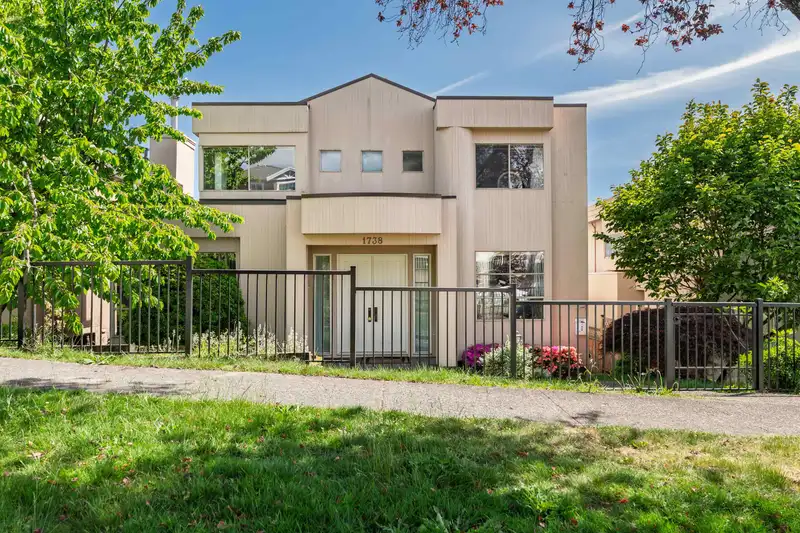
Top-quality custom-built home in the desirable Fraserview neighbourhood. Situated on a quiet street w/ a sunny south-facing backyard & beautiful open views toward Richmond. Spacious & functional layout featuring generous living areas & excellent natural light throughout. Upstairs, there are 4 spacious bedrooms, perfect for growing families. The legal…
Top-quality custom-built home in the desirable Fraserview neighbourhood. Situated on a quiet street w/ a sunny south-facing backyard & beautiful open views toward Richmond. Spacious & functional layout featuring generous living areas & excellent natural light throughout. Upstairs, there are 4 spacious bedrooms, perfect for growing families. The legal separate entry basement includes a 3-bedroom & 2-bathroom suite, providing excellent mortgage helper potential. Conveniently located near parks, schools, shopping, transit, and Fraser River trails. Easy access to Richmond, Burnaby, and Downtown Vancouver via Marine Drive and Knight Street. Wonderful opportunity to own a quality family home in one of South Vancouver’s most sought-after communities. Open house 2-4pm on June 13 and 14.
Features
Balcony
Garage Triple
Rear Access
Room measurements15 rooms▸
Living RoomMain · 13'5 × 14'
Dining RoomMain · 12' × 13'
KitchenMain · 9' × 13'
Family RoomMain · 11' × 17'5
BedroomMain · 12' × 10'
FoyerMain · 12' × 11'
NookMain · 11' × 10'
Primary BedroomAbove · 12' × 18'5
BedroomAbove · 10' × 11'
BedroomAbove · 12' × 11'
BedroomAbove · 12' × 11'
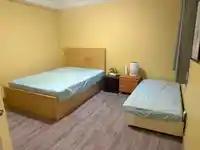
BedroomBsmt · 12' × 18'5
BedroomBsmt · 13' × 10'
BedroomBsmt · 11'5 × 10'
LaundryBsmt · 7'5 × 11'
Floor plan
🔍 Tap to zoom
Pinch or scroll to zoom · drag to pan · double-tap to reset
Property Details
MLS NumberR3122335
Property TypeSingle Family Residence
Bedrooms8
Bathrooms6
Square Feet3,514
Lot Size5,856 sqft
Year Built1991
Parking Spaces3
HeatingBaseboard
StatusClosed
Listed ByLaboutique Realty
School Catchment
ElementaryDouglas
SecondaryDavid Thompson
Neighbourhood
Highlighted area = this home's census tract (StatCan), the boundary the neighbourhood stats describe.
$1,100,000Median home value
$95,000Median household income
71.7%Owner-occupied
23.9%Single-detached homes
2.7Avg household size
47.2Median age
39.6%Bachelor's degree or higher (25-64)
53.4%Commute under 30 min
76.2%Drive to work
46.9%Foreign-born residents
4,527Neighbourhood population
Age
Under 1512.6%
15 to 6462.2%
65 and over25.2%
Household size
1 person25.2%
229.9%
318.6%
414.2%
5 or more12.3%
Language spoken at home
42.9% English mother tongue
Cantonese16.7%
English + other5.7%
Punjabi5.3%
Spanish3.3%
Tagalog3.2%
Mandarin3%
All others19.9%
Mother tongue, share of 4,360 residents.
How this pocket differs
more seniors 65+ than South Marine 25.2% vs 17.8%
notably more 5+ person households than South Marine 12.3% vs 6.9%
notably more Punjabi speakers than South Marine 5.3% vs 2.3%
notably fewer Mandarin speakers than South Marine 3% vs 4.7%
Source: Statistics Canada, Census of Population, 2021. Reproduced and distributed on an "as is" basis with the permission of Statistics Canada.
Land & Development
Lot size5,857 sqft
Lot dimensions48 × 122 ft
Lot shapeRectangular
Approximate lot lines (ParcelMap BC)
Zoning, lot dimensions and grade are approximate, from public data, and for reference only — verify with the City / Township of Langley before relying on them.
Recent nearby sales
Sold prices are available to registered users. Log in to see what these sold for.

 1 / 40 photos