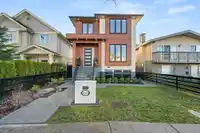
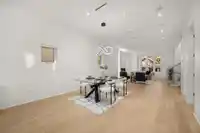
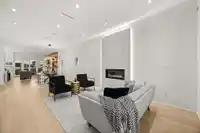
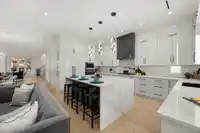
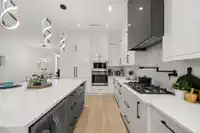
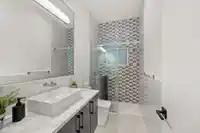
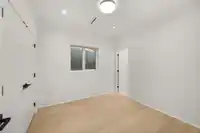
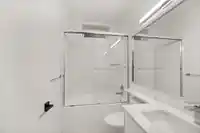
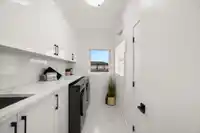
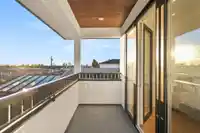
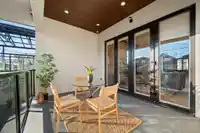
Welcome to this brand-new, custom-built modern luxury home in the highly sought-after Willingdon Heights, offering over 3500sqft of living space with 7 beds & 6 baths. Home features a bright open-concept layout w/ 10ft ceilings, radiant heating, AC, & elegant contemporary-traditional finishes. Gourmet kitchen is equipped w/ high-end built-in Fisher & Paykel…
Welcome to this brand-new, custom-built modern luxury home in the highly sought-after Willingdon Heights, offering over 3500sqft of living space with 7 beds & 6 baths. Home features a bright open-concept layout w/ 10ft ceilings, radiant heating, AC, & elegant contemporary-traditional finishes. Gourmet kitchen is equipped w/ high-end built-in Fisher & Paykel appliances, pot filler, oversized waterfall island, & quartz countertops & backsplash & opens onto a spacious sundeck. Also includes a media room, legal two-bed suite offering excellent flexibility or rental income, HRV system, built-in vacuum, security cameras, & a prime central location close to Brentwood Town Centre, transit, Safeway, cafés, & restaurants. Situated in Rosser Elementary & Alpha Secondary school catchments. CALL NOW!
Features
Storage
Balcony
Private Yard
Garage Double
Lane Access
Rear Access
Concrete
Shopping Nearby
Room measurements20 rooms▸
Primary BedroomAbove · 18'2 × 13'7
Walk-In ClosetAbove · 7'9 × 4'7
BedroomAbove · 11'10 × 13'7
Walk-In ClosetAbove · 6'2 × 4'7
BedroomAbove · 10'4 × 10'1
LaundryAbove · 5'10 × 10'0
StorageAbove · 2'8 × 4'6
KitchenMain · 18'5 × 9'11
Family RoomMain · 16'3 × 13'5
Dining RoomMain · 17'9 × 13'9
Living RoomMain · 15'10 × 13'7
BedroomMain · 10'1 × 9'7
FoyerMain · 5'11 × 9'11
Recreation RoomBelow · 18'10 × 15'10
BedroomBelow · 10'11 × 10'2
UtilityBelow · 6'7 × 6'6
KitchenBelow · 11'2 × 13'10
Living RoomBelow · 11'5 × 11'9
BedroomBelow · 10'9 × 10'3
BedroomBelow · 12'6 × 11'10
Floor plan
🔍 Tap to zoom
Pinch or scroll to zoom · drag to pan · double-tap to reset
Property Details
MLS NumberR3148069
Property TypeSingle Family Residence
Bedrooms7
Bathrooms6
Square Feet3,412
Lot Size4,026 sqft
Year Built2023
Parking Spaces2
HeatingHot Water, Radiant
Days on Market95
StatusActive
Listed ByLuxmore Realty
School Catchment
ElementaryRosser
SecondaryAlpha
Neighbourhood
Highlighted area = this home's census tract (StatCan), the boundary the neighbourhood stats describe.
$1,500,000Median home value
$88,000Median household income
65.7%Owner-occupied
27.2%Single-detached homes
2.6Avg household size
43.2Median age
37.5%Bachelor's degree or higher (25-64)
55.8%Commute under 30 min
73.7%Drive to work
44.2%Foreign-born residents
5,442Neighbourhood population
Age
Under 1514.4%
15 to 6465.9%
65 and over19.7%
Household size
1 person28.2%
229.1%
317.1%
415.5%
5 or more10.1%
Language spoken at home
46.8% English mother tongue
Cantonese18.6%
Italian5.5%
Mandarin4.8%
English + other4.6%
Vietnamese2.1%
Tagalog1.7%
All others15.9%
Mother tongue, share of 5,440 residents.
How this pocket differs
more 5+ person households than Burnaby North 10.1% vs 7.1%
notably more Italian speakers than Burnaby North 5.5% vs 2.5%
notably fewer Mandarin speakers than Burnaby North 4.8% vs 8.7%
notably more Cantonese speakers than Burnaby North 18.6% vs 11.7%
Median dwelling value is higher than Metro Vancouver $1,500,000 vs $1,050,000
Source: Statistics Canada, Census of Population, 2021. Reproduced and distributed on an "as is" basis with the permission of Statistics Canada.
Land & Development
Lot size4,021 sqft
Lot dimensions33 × 121 ft
Lot shapeRectangular
Approximate lot lines (ParcelMap BC)
Zoning, lot dimensions and grade are approximate, from public data, and for reference only — verify with the City / Township of Langley before relying on them.
Recent nearby sales
Sold prices are available to registered users. Log in to see what these sold for.

 1 / 40 photos