
 1 / 36 photos

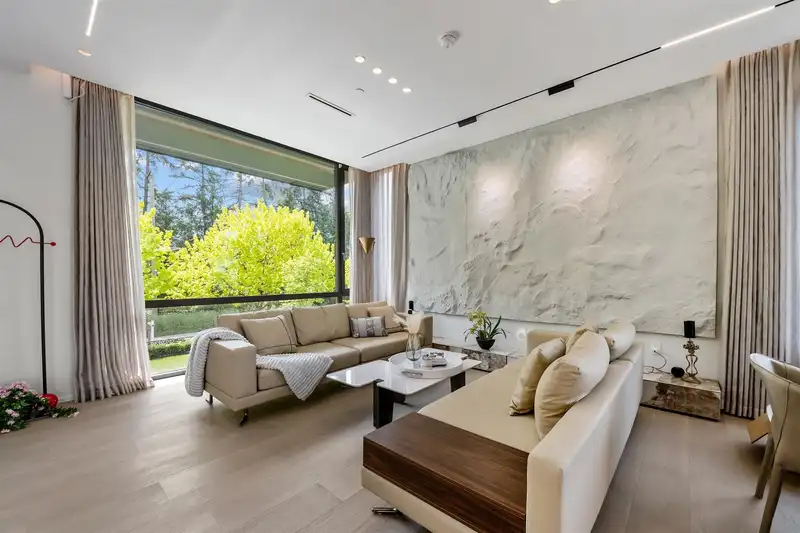










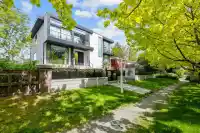
About This Property
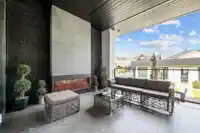
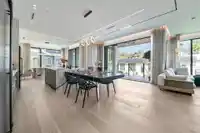
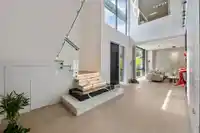
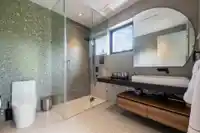
Southlands lifestyle across from Point Grey Golf and Country Club. This 4200sf+ custom built MODERN masterpiece is situated on a 66x148.6=9807.6sf of Southern facing property. Main floor features double height foyer, formal L/R & D/R opens onto a large covered deck w/FP, top of the line appliances in both main and wok kitchens, huge kit. island, breakfast…
Features
Property Details
School Catchment
Neighbourhood
Age
- Under 1514.1%
- 15 to 6465.4%
- 65 and over20.4%
Household size
- 1 person20.7%
- 230.2%
- 318.4%
- 420%
- 5 or more10.8%
Language spoken at home
60.5% English mother tongue
Mother tongue, share of 4,210 residents.
How this pocket differs
- more children under 15 than Vancouver West 14.1% vs 9.9%
- more seniors 65+ than Vancouver West 20.5% vs 16.8%
- notably more 5+ person households than Vancouver West 10.9% vs 3.5%
- notably more 4-person households than Vancouver West 20.1% vs 7.6%
- notably fewer people living alone than Vancouver West 20.7% vs 43.6%
- more Mandarin speakers than Vancouver West 13.9% vs 9.7%
- Median household income is notably higher than Metro Vancouver $143,000 vs $90,000
- Median dwelling value is notably higher than Metro Vancouver $3,200,000 vs $1,050,000
Source: Statistics Canada, Census of Population, 2021. Reproduced and distributed on an "as is" basis with the permission of Statistics Canada.
Land & Development
Zoning, lot dimensions and grade are approximate, from public data, and for reference only — verify with the City / Township of Langley before relying on them.
Recent nearby sales
Sold prices are available to registered users. Log in to see what these sold for.
Monthly Cost Calculator
An estimate only. Canadian semi-annual compounding; excludes utilities, closing costs and BC property transfer tax. 5-year fixed, as of Oct 19
Similar Listings Nearby
6109 HIGHBURY STREET
3535 W 47TH AVENUE
5819 WALLACE STREET
5788 CROWN STREET
5562 CROWN STREET
3549 W 40TH AVENUE
3838 W 38TH AVENUE
3848 W 38TH AVENUE
3587 MAYFAIR AVENUE
4041 W 39TH AVENUE
3491 W 40TH AVENUE
3870 W 37TH AVENUE