
 1 / 24 photos










About This Property
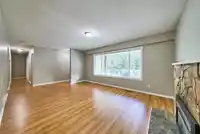
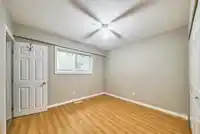
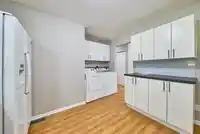
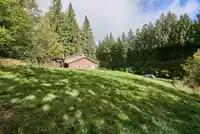
Your Place in the Country! Escape the hustle and bustle of city life in this charming 3-bedroom rancher on a 1.27-acre private, treed lot. This well-kept home features a spacious living room with a cozy gas fireplace, easy-care laminate flooring, and sliding doors from the dining area to a huge 62' x 17' patio-perfect for entertaining or relaxing. Updates…
Features
Property Details
School Catchment
Neighbourhood
Age
- Under 1516.7%
- 15 to 6467.5%
- 65 and over15.8%
Household size
- 1 person15.1%
- 234.4%
- 318.5%
- 418.7%
- 5 or more13.3%
Language spoken at home
81.6% English mother tongue
Mother tongue, share of 6,710 residents.
How this pocket differs
- fewer seniors 65+ than East Central 15.8% vs 20.6%
- notably fewer people living alone than East Central 15.1% vs 32.5%
- notably more 5+ person households than East Central 13.4% vs 7.5%
- notably more 4-person households than East Central 18.8% vs 12.3%
- notably more Mandarin speakers than East Central 3% vs 1.6%
- Median household income is higher than Metro Vancouver $113,000 vs $90,000
Source: Statistics Canada, Census of Population, 2021. Reproduced and distributed on an "as is" basis with the permission of Statistics Canada.
Land & Development
Zoning, lot dimensions and grade are approximate, from public data, and for reference only — verify with the City / Township of Langley before relying on them.
Recent nearby sales
Sold prices are available to registered users. Log in to see what these sold for.
Monthly Cost Calculator
An estimate only. Canadian semi-annual compounding; excludes utilities, closing costs and BC property transfer tax. 5-year fixed, as of Oct 22
Similar Listings Nearby
12114 ROTHSAY STREET
27573 SAYERS CRESCENT
11760 272 STREET
27660 128 AVENUE
26814 DEWDNEY TRUNK ROAD
11185 272 STREET
12121 264 STREET
27601 104 AVENUE
12063 287TH STREET
11367 261 STREET
26280 GRANT AVENUE
25443 BOSONWORTH AVENUE