
 1 / 6 photos





About This Property
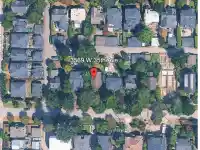
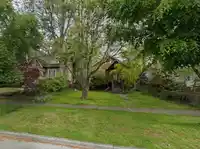
PRIME DUNBAR LAND OPPORTUNITY! Discover the potential of 3569 W 35th Avenue in one of Vancouver’s most desirable West Side neighbourhoods. Known for its leafy streets, established homes&welcoming community, Dunbar blends residential charm with everyday convenience. Enjoy local cafés, shops&restaurants along Dunbar Street, plus recreation at Dunbar Community…
Features
Property Details
School Catchment
Neighbourhood
Age
- Under 1513.6%
- 15 to 6467.8%
- 65 and over18.6%
Household size
- 1 person18.8%
- 232.6%
- 317.7%
- 419.5%
- 5 or more11.4%
Language spoken at home
58% English mother tongue
Mother tongue, share of 6,005 residents.
How this pocket differs
- more children under 15 than Vancouver West 13.7% vs 9.9%
- notably more 5+ person households than Vancouver West 11.3% vs 3.5%
- notably more 4-person households than Vancouver West 19.4% vs 7.6%
- notably fewer people living alone than Vancouver West 18.8% vs 43.6%
- notably more Mandarin speakers than Vancouver West 19.8% vs 9.7%
- Median household income is higher than Metro Vancouver $123,000 vs $90,000
- Median dwelling value is notably higher than Metro Vancouver $3,200,000 vs $1,050,000
Source: Statistics Canada, Census of Population, 2021. Reproduced and distributed on an "as is" basis with the permission of Statistics Canada.
Land & Development
Zoning, lot dimensions and grade are approximate, from public data, and for reference only — verify with the City / Township of Langley before relying on them.
Recent nearby sales
Sold prices are available to registered users. Log in to see what these sold for.
Monthly Cost Calculator
An estimate only. Canadian semi-annual compounding; excludes utilities, closing costs and BC property transfer tax. 5-year fixed, as of Oct 15
Similar Listings Nearby
3587 W 38TH AVENUE
3581 W 32ND AVENUE
3441 W 35TH AVENUE
3456 W 36TH AVENUE
3758 W 35TH AVENUE
5480 COLLINGWOOD STREET
3549 W 40TH AVENUE
3491 W 40TH AVENUE
5030 BLENHEIM STREET
3657 W 29TH AVENUE
3825 W 31ST AVENUE
3328 W 30TH AVENUE