
 1 / 1 photos
About This Property
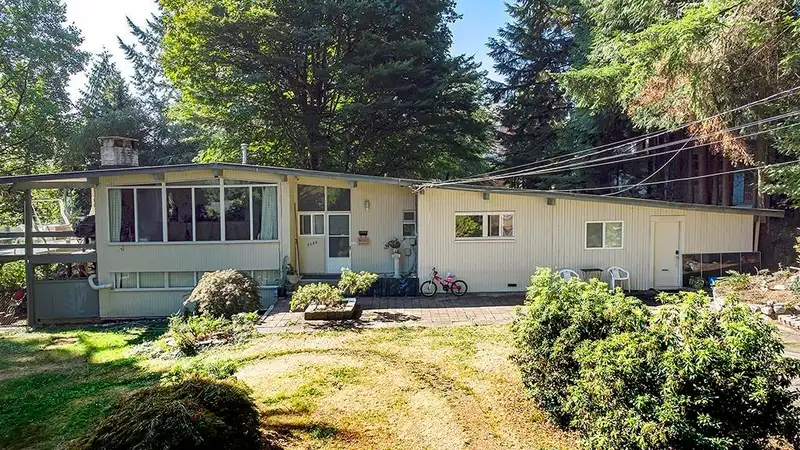
Sub-dividable property meets requirements for subdividing into 2 single family lots. Verify with City. RS1 zoning, 20,000 sq ft flat lot in a quiet cul-de-sac location. Private yard. Home needs work. Easily rentable while being developed.
Features
Property Details
School Catchment
Neighbourhood
Age
- Under 1515.6%
- 15 to 6467.7%
- 65 and over16.8%
Household size
- 1 person13.3%
- 231.8%
- 320.8%
- 421.1%
- 5 or more13%
Language spoken at home
57% English mother tongue
Mother tongue, share of 7,800 residents.
How this pocket differs
- notably fewer people living alone than Coquitlam 13.3% vs 22.9%
- more 5+ person households than Coquitlam 12.9% vs 9.3%
- more 4-person households than Coquitlam 21.1% vs 17.2%
- notably fewer Mandarin speakers than Coquitlam 6.1% vs 9.7%
- fewer Cantonese speakers than Coquitlam 5.1% vs 6.5%
- fewer Farsi speakers than Coquitlam 4% vs 5.1%
- Median household income is higher than Metro Vancouver $115,000 vs $90,000
Source: Statistics Canada, Census of Population, 2021. Reproduced and distributed on an "as is" basis with the permission of Statistics Canada.
Land & Development
Zoning, lot dimensions and grade are approximate, from public data, and for reference only — verify with the City / Township of Langley before relying on them.
Recent nearby sales
Sold prices are available to registered users. Log in to see what these sold for.
Monthly Cost Calculator
An estimate only. Canadian semi-annual compounding; excludes utilities, closing costs and BC property transfer tax. 5-year fixed, as of Oct 21
Similar Listings Nearby
2957 STARLIGHT WAY
740 CLEARWATER WAY
2902 PAUL LAKE COURT
2776 WESTLAKE DRIVE
3028 STARLIGHT WAY
2714 MARA DRIVE
2740 WESTLAKE DRIVE
2713 MARA DRIVE
2917 KALAMALKA DRIVE
2779 SYLVAN PLACE
2904 TATLA PLACE
2950 KEETS DRIVE