
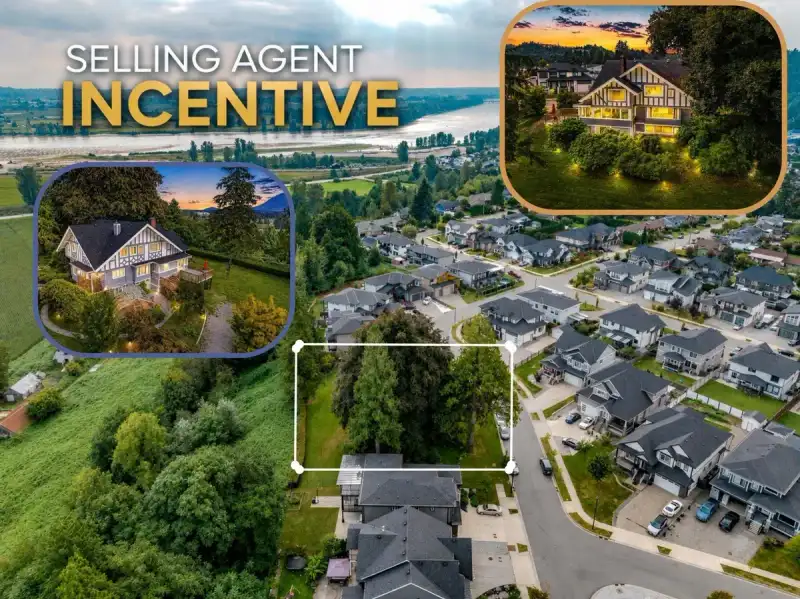
$2,389,000

Address not disclosed

Mission BC - Hatzic
6 bd
6.5 ba
5,437 sqft
Built 1911

About This Property

Hatzic Bench

Features

Private Yard
Additional Parking
Front Access
Shopping Nearby
Room measurements26 rooms▸
Dining RoomMain · 11' × 14'6
Living RoomMain · 13'5 × 14'6
Family RoomMain · 15'2 × 31'3
NookMain · 10'9 × 8'11
Eating AreaMain · 9' × 8'4
KitchenMain · 10'6 × 9'5
FoyerMain · 4'8 × 5'9
SolariumMain · 21'4 × 13'8
Primary BedroomAbove · 17'8 × 21'3
Walk-In ClosetAbove · 10'6 × 8'
BedroomAbove · 14'2 × 10'11
Walk-In ClosetAbove · 8'7 × 6'4
BedroomAbove · 10'10 × 13'
Walk-In ClosetAbove · 5' × 6'1
BedroomAbove · 10'11 × 13'
BedroomAbove · 15'6 × 7'4
DenAbove · 6'11 × 13'11
BedroomBelow · 14'1 × 10'2
Dining RoomBelow · 13'10 × 17'5
DenBelow · 10'4 × 20'7
KitchenBelow · 6'10 × 10'1
UtilityBelow · 8'6 × 20'1
StorageBelow · 24'6 × 14'3
FoyerBelow · 4'3 × 6'11
StorageBelow · 6'10 × 6'10
LaundryBelow · 11'9 × 12'4

Property Details

MLS NumberR3153954
Property TypeSingle Family Residence
Bedrooms6
Bathrooms6.5
Square Feet5,437
Year Built1911
Parking Spaces1
HeatingBaseboard
Days on Market107
StatusActive
Listed ByRoyal LePage Elite West

School Catchment

Elementary Hatzic Elementary
Secondary Mission Senior Secondary

Neighbourhood

Highlighted area = this home's census tract (StatCan), the boundary the neighbourhood stats describe.
$900,000Median home value
$110,000Median household income
87.9%Owner-occupied
84.3%Single-detached homes
2.9Avg household size
42.8Median age
16.1%Bachelor's degree or higher (25-64)
54.8%Commute under 30 min
96.2%Drive to work
17.4%Foreign-born residents
3,787Neighbourhood population

Age

Under 15: 17.9%15 to 64: 62.7%65 and over: 19.4%
  • Under 1517.9%
  • 15 to 6462.7%
  • 65 and over19.4%

Household size

  • 1 person16.9%
  • 235.7%
  • 315.3%
  • 415.3%
  • 5 or more16.9%

Language spoken at home

83.8% English mother tongue

  • Punjabi4.9%
  • English + other1.3%
  • French1.2%
  • German0.9%
  • Tagalog0.8%
  • Spanish0.7%
  • All others6.4%

Mother tongue, share of 3,790 residents.

How this pocket differs

  • more seniors 65+ than Mission BC 19.4% vs 15.5%
  • notably fewer Punjabi speakers than Mission BC 4.9% vs 7.9%
  • Median household income is higher than Abbotsford-Mission $110,000 vs $91,000

Source: Statistics Canada, Census of Population, 2021. Reproduced and distributed on an "as is" basis with the permission of Statistics Canada.

Land & Development

Lot size26,214 sqft
Lot dimensions138 × 210 ft
Lot shapeSlightly irregular
Approximate lot lines (ParcelMap BC)

Zoning, lot dimensions and grade are approximate, from public data, and for reference only — verify with the City / Township of Langley before relying on them.

Recent nearby sales

Sold prices are available to registered users. Log in to see what these sold for.

Monthly Cost Calculator

Estimated monthly cost $11,743
Mortgage payment$11,148
Property tax$355
Home insurance$240
Partner Rates Available Contact us for preferred mortgage rates

An estimate only. Canadian semi-annual compounding; excludes utilities, closing costs and BC property transfer tax. 5-year fixed, as of Nov 19

Book a Showing