
 1 / 21 photos


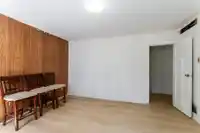


About This Property
A2 Zoned just over One-Acre (44, 823 square foot) level lot on Burnaby's South Slope in the Big Bend area. Build your Custom estate home! Good soil for vegetable gardening and landscaping. 10 minutes to Metrotown and 5 minutes to 22nd Street Skytrain station. Market Crossing shopping Centre is only 2.5-kilometres away. Easy access to Riverway Golf course,…
Features
Property Details
School Catchment
Neighbourhood
Age
- Under 1516.7%
- 15 to 6468.1%
- 65 and over15.2%
Household size
- 1 person20%
- 226.3%
- 321.1%
- 418.9%
- 5 or more13.7%
Language spoken at home
44.7% English mother tongue
Mother tongue, share of 1,365 residents.
How this pocket differs
- more children under 15 than Burnaby South 16.6% vs 12.4%
- notably more 5+ person households than Burnaby South 13.8% vs 7.7%
- notably more 4-person households than Burnaby South 19.1% vs 12.3%
- notably fewer people living alone than Burnaby South 20.2% vs 30.4%
- notably more Punjabi speakers than Burnaby South 5.1% vs 2.3%
- notably fewer Mandarin speakers than Burnaby South 8.8% vs 17.4%
Source: Statistics Canada, Census of Population, 2021. Reproduced and distributed on an "as is" basis with the permission of Statistics Canada.
Land & Development
Zoning, lot dimensions and grade are approximate, from public data, and for reference only — verify with the City / Township of Langley before relying on them.
Recent nearby sales
Sold prices are available to registered users. Log in to see what these sold for.
Monthly Cost Calculator
An estimate only. Canadian semi-annual compounding; excludes utilities, closing costs and BC property transfer tax. 5-year fixed, as of Oct 27
Similar Listings Nearby
6062 12TH AVENUE
2309 DUBLIN STREET
2235 EDINBURGH STREET
2233 EDINBURGH STREET
2206 LONDON STREET
2204 HAMILTON STREET
2141 MARINE WAY
23271 WESTMINSTER HIGHWAY
6069 PATRICK STREET
1940 DUBLIN STREET
23177 WILLETT AVENUE
2011 SEVENTH AVENUE