
 1 / 18 photos


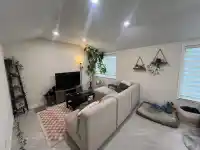
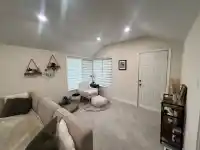











About This Property
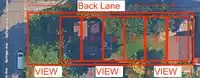
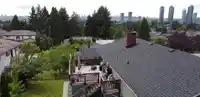
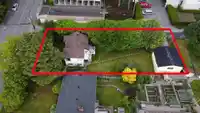
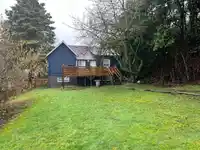
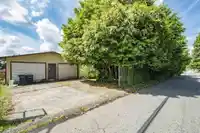
ATTN Developers: Exceptional corner lot offering 8,478 sq ft with views in Burnaby North. Zoned for up to 6 units, this property is ideally positioned for a row home, multiplex, or innovative middle-market housing project. Located one block from Hastings Street, minutes to Brentwood Mall and SkyTrain, and close to Capitol Hill Elementary, parks, and…
Features
Property Details
School Catchment
Neighbourhood
Age
- Under 1513.7%
- 15 to 6467.4%
- 65 and over18.9%
Household size
- 1 person19.5%
- 230.5%
- 318.1%
- 418.1%
- 5 or more13.8%
Language spoken at home
44.6% English mother tongue
Mother tongue, share of 6,930 residents.
How this pocket differs
- notably more 5+ person households than Burnaby North 13.8% vs 7.1%
- notably fewer people living alone than Burnaby North 19.5% vs 29.8%
- more 4-person households than Burnaby North 18.1% vs 13.2%
- notably more Italian speakers than Burnaby North 3.9% vs 2.5%
- notably more Mandarin speakers than Burnaby North 13.3% vs 8.7%
- Median dwelling value is notably higher than Metro Vancouver $1,700,000 vs $1,050,000
Source: Statistics Canada, Census of Population, 2021. Reproduced and distributed on an "as is" basis with the permission of Statistics Canada.
Land & Development
Zoning, lot dimensions and grade are approximate, from public data, and for reference only — verify with the City / Township of Langley before relying on them.
Recent nearby sales
Sold prices are available to registered users. Log in to see what these sold for.
Monthly Cost Calculator
An estimate only. Canadian semi-annual compounding; excludes utilities, closing costs and BC property transfer tax. 5-year fixed, as of Oct 15
Similar Listings Nearby
5395 GEORGIA STREET
4993 VENABLES STREET
75 SPRINGER AVENUE
380 DELTA AVENUE
26 RANELAGH AVENUE
4990 EMPIRE DRIVE
5307 SPRINGDALE COURT
18 HYTHE AVENUE
5410 PARKER STREET
11 HYTHE AVENUE
175 DELTA AVENUE
155 ELLESMERE AVENUE