
 1 / 40 photos















About This Property
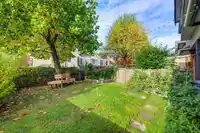
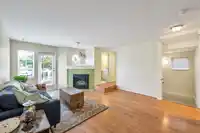
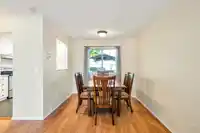
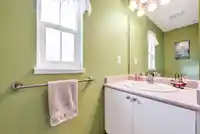
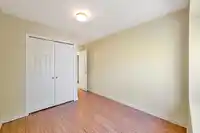
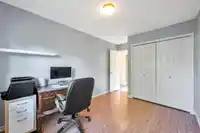
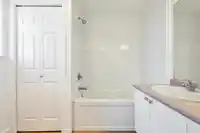
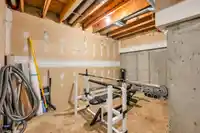
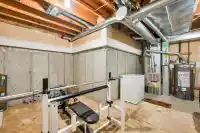
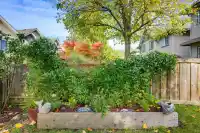
Rediscover community in Foxfield! This end unit/duplex style home offers tons of space with 1654 sq ft, 3 bdrms, 3 bthrms all in this family friendly complex! There are 2 outdoor spaces to enjoy! Upper balcony overlooking the park and walk out to the lower patio with massive fenced yard! Rare to find a yard this size ~ perfect for kids and pets. Kitchen has…
Features
Property Details
School Catchment
Neighbourhood
Age
- Under 1518.4%
- 15 to 6467.6%
- 65 and over14%
Household size
- 1 person18%
- 233.3%
- 320.8%
- 417.3%
- 5 or more10.6%
Language spoken at home
71.6% English mother tongue
Mother tongue, share of 3,500 residents.
How this pocket differs
- fewer seniors 65+ than East Central 14% vs 20.6%
- more children under 15 than East Central 18.4% vs 14.3%
- notably fewer people living alone than East Central 18.1% vs 32.5%
- more 4-person households than East Central 17.3% vs 12.3%
- more 5+ person households than East Central 10.6% vs 7.5%
- notably more Punjabi speakers than East Central 3.4% vs 1.4%
- Median dwelling value is lower than Metro Vancouver $720,000 vs $1,050,000
Source: Statistics Canada, Census of Population, 2021. Reproduced and distributed on an "as is" basis with the permission of Statistics Canada.
Recent nearby sales
Sold prices are available to registered users. Log in to see what these sold for.
Monthly Cost Calculator
An estimate only. Canadian semi-annual compounding; excludes utilities, closing costs and BC property transfer tax. 5-year fixed, as of Oct 23
Similar Listings Nearby
32 23151 HANEY BYPASS
22 23151 HANEY BYPASS
22 23108 LOUGHEED HIGHWAY
1060 11280 PAZARENA PLACE
14 23281 KANAKA WAY
602 11295 PAZARENA PLACE
1301 11295 PAZARENA PLACE
2104 11295 PAZARENA PLACE
1406 11295 PAZARENA PLACE
15 11355 COTTONWOOD DRIVE
15 23281 KANAKA WAY
3 11282 COTTONWOOD DRIVE