
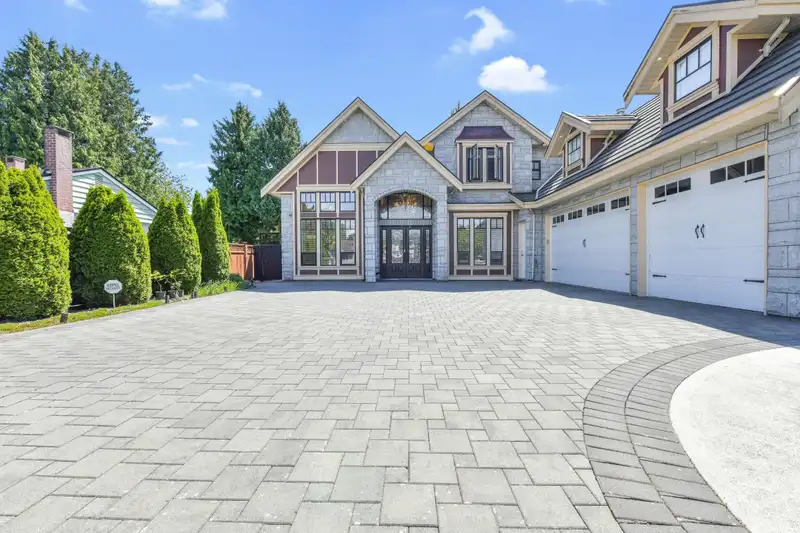
 1 / 40 photos


About This Property
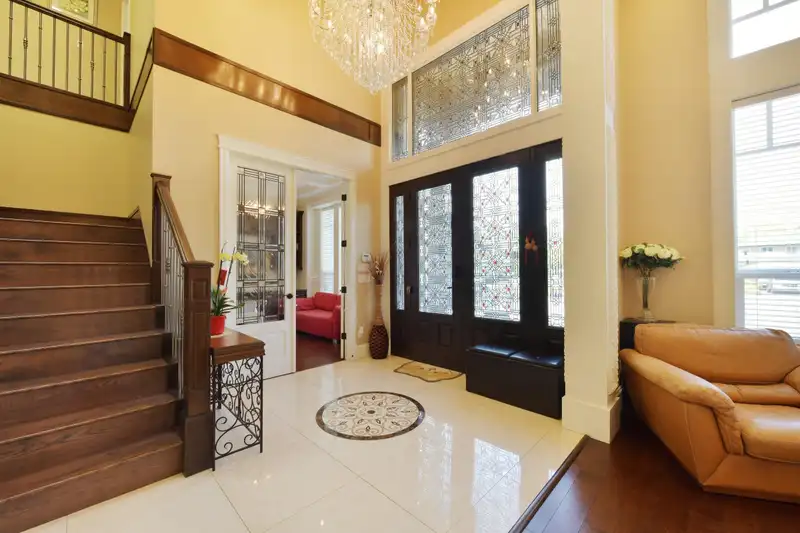
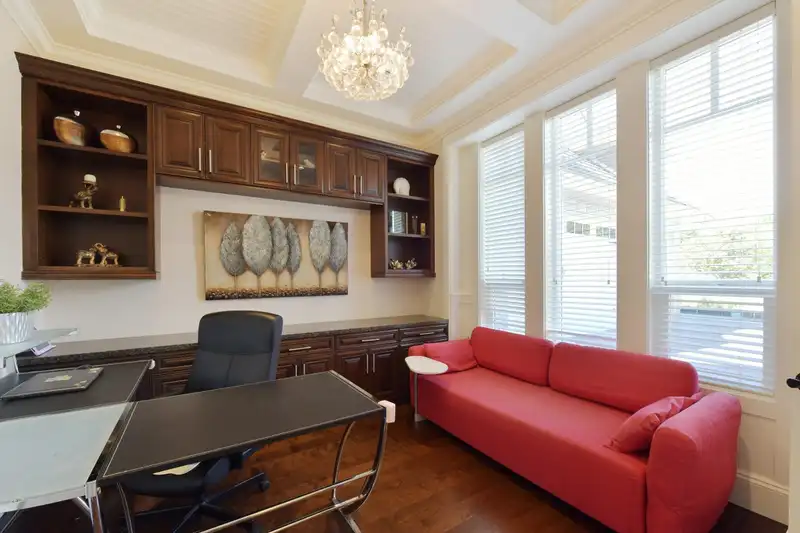
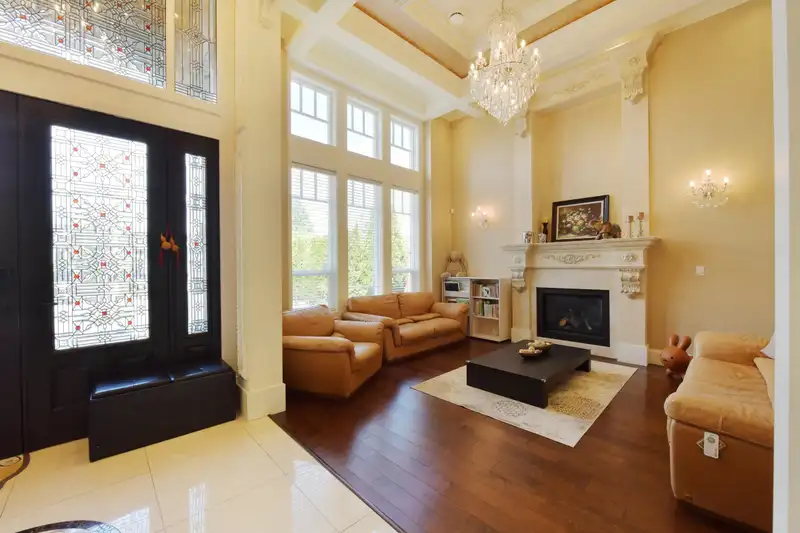
Beautiful 66 x 120 full size lots in Seafair! Sunny southern backyard with new garden erupted in 2021 !! Custom built, very fine wood work, crown moulding and hand-painted ceiling, newly updated (2020) hardwood floor throughout the second floor. Massive granite tops and imported Italian tiles on kitchen splash, all the designer lighting fixture are quality…
Features
Property Details
School Catchment
Neighbourhood
Age
- Under 1514.8%
- 15 to 6465.6%
- 65 and over19.6%
Household size
- 1 person16.4%
- 230.7%
- 321.3%
- 421.6%
- 5 or more9.9%
Language spoken at home
41.8% English mother tongue
Mother tongue, share of 4,845 residents.
How this pocket differs
- notably fewer people living alone than Richmond 16.4% vs 25.1%
- more 4-person households than Richmond 21.6% vs 14.7%
- fewer Cantonese speakers than Richmond 15.1% vs 21.5%
- Median dwelling value is higher than Metro Vancouver $1,500,000 vs $1,050,000
Source: Statistics Canada, Census of Population, 2021. Reproduced and distributed on an "as is" basis with the permission of Statistics Canada.
Land & Development
Zoning, lot dimensions and grade are approximate, from public data, and for reference only — verify with the City / Township of Langley before relying on them.
Recent nearby sales
Sold prices are available to registered users. Log in to see what these sold for.
Monthly Cost Calculator
An estimate only. Canadian semi-annual compounding; excludes utilities, closing costs and BC property transfer tax. 5-year fixed, as of Oct 30
Similar Listings Nearby
9140 DIAMOND ROAD
3651 FRANCIS ROAD
3600 RAYMOND AVENUE
3711 ULLSMORE AVENUE
3531 ROSAMOND AVENUE
9211 NO. 1 ROAD
3491 TRUMOND AVENUE
3471 TRUMOND AVENUE
9571 DIAMOND ROAD
8408 LAIDMORE ROAD
8520 ELSMORE ROAD
3420 ROSAMOND AVENUE