
 1 / 31 photos












About This Property
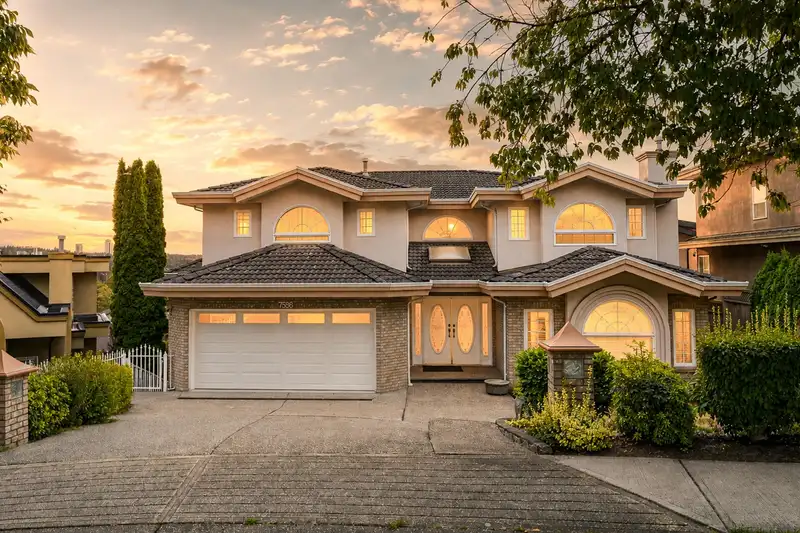
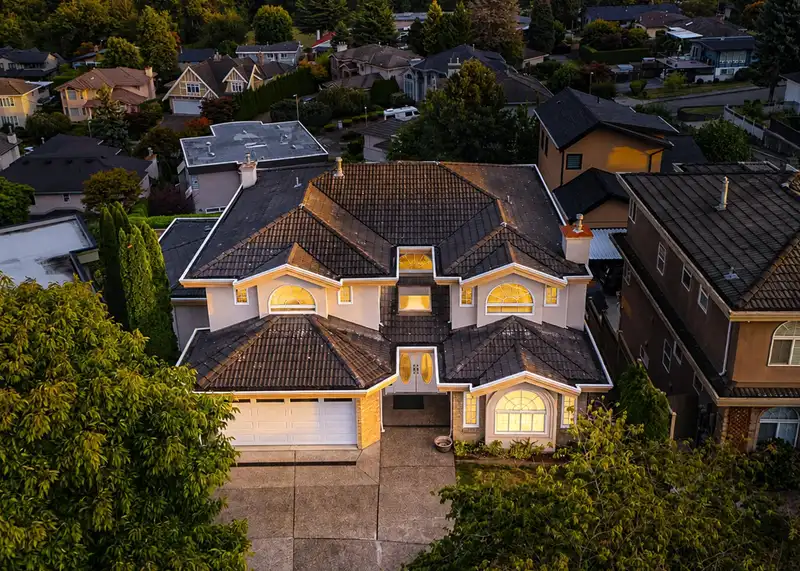
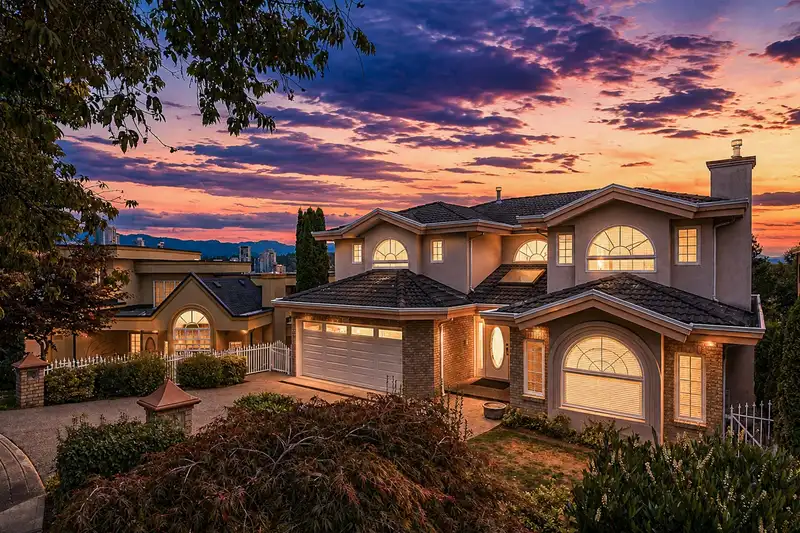
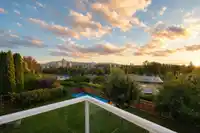
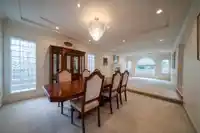
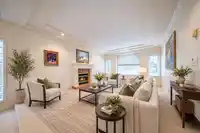
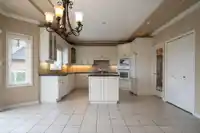
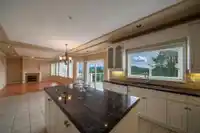
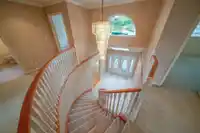
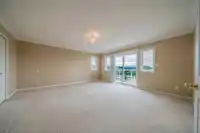
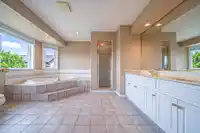
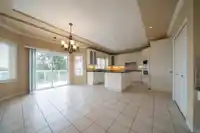
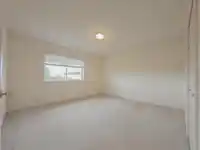
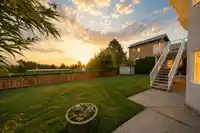
Prestige area in Burnaby East 3 level Custom-Build Home sitting on over 8700sqft lot interior finish over 5200sqft; well kept solid built with very functional open layout with full mountain view. Close to schools, park, easy highway access, Costco, Metrotown & Brentwood Mall.
Features
Property Details
School Catchment
Neighbourhood
Age
- Under 1516.6%
- 15 to 6464%
- 65 and over19.4%
Household size
- 1 person16.3%
- 228.1%
- 320.3%
- 421.2%
- 5 or more14.1%
Language spoken at home
47.9% English mother tongue
Mother tongue, share of 7,005 residents.
How this pocket differs
- fewer people living alone than Burnaby East 16.3% vs 21.5%
- more 4-person households than Burnaby East 21.2% vs 16.8%
- notably more Korean speakers than Burnaby East 3.9% vs 2.2%
- notably fewer Mandarin speakers than Burnaby East 6.9% vs 10.4%
- Median dwelling value is higher than Metro Vancouver $1,300,000 vs $1,050,000
Source: Statistics Canada, Census of Population, 2021. Reproduced and distributed on an "as is" basis with the permission of Statistics Canada.
Land & Development
Zoning, lot dimensions and grade are approximate, from public data, and for reference only — verify with the City / Township of Langley before relying on them.
Recent nearby sales
Sold prices are available to registered users. Log in to see what these sold for.
Monthly Cost Calculator
An estimate only. Canadian semi-annual compounding; excludes utilities, closing costs and BC property transfer tax. 5-year fixed, as of Oct 19
Similar Listings Nearby
7505 MANZANITA PLACE
9113 BRIAR ROAD
9152 KLENNER DRIVE
7749 LEE STREET
7779 ELFORD STREET
7790 ELFORD STREET
8915 MONROE AVENUE
8758 CREST DRIVE
9025 BRIAR ROAD
550 RICHMOND STREET
917 LADNER STREET
335 CHURCHILL AVENUE