
 1 / 30 photos



About This Property
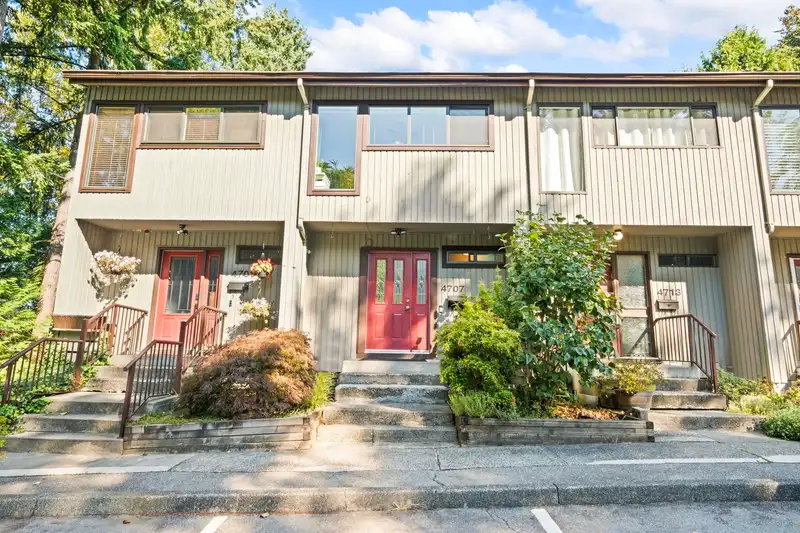
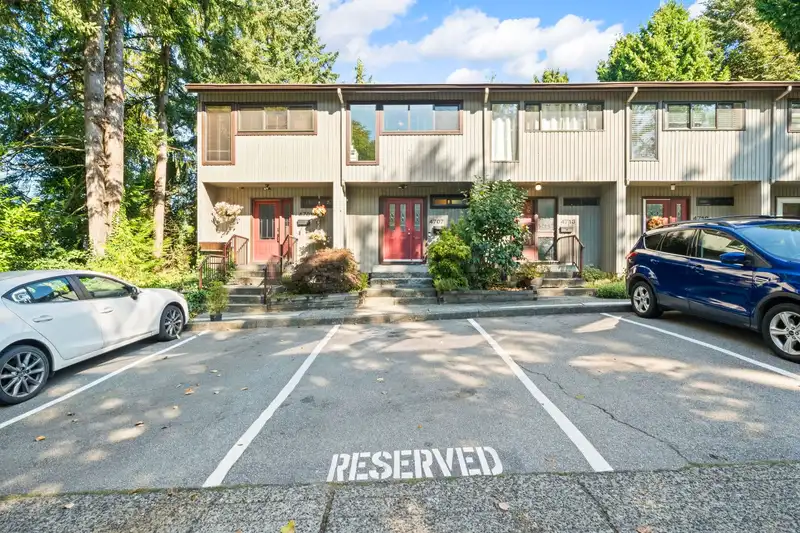
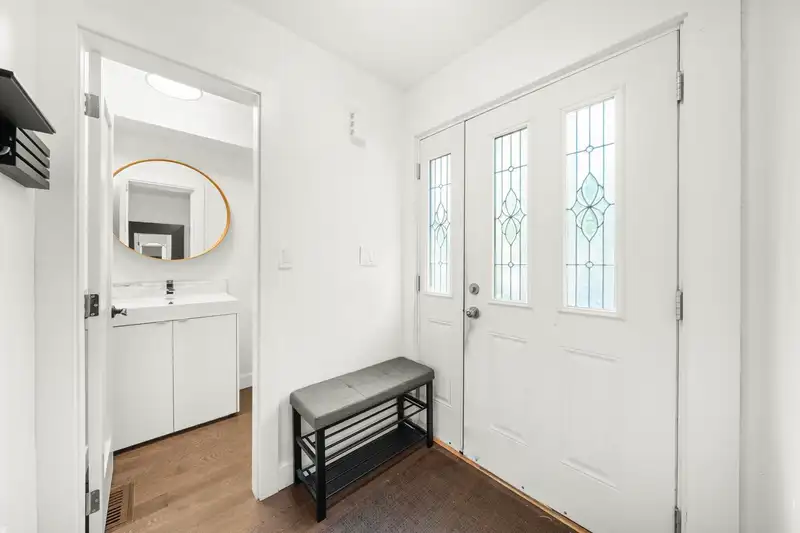
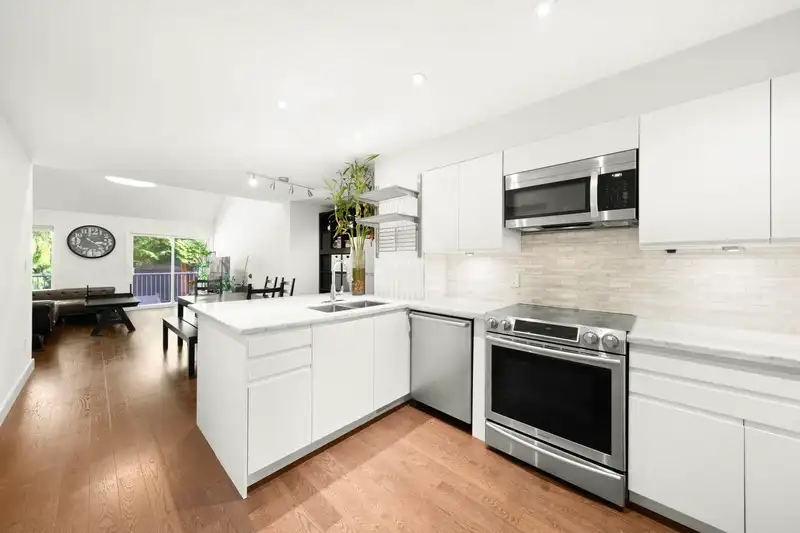
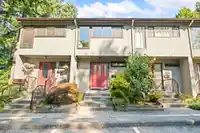
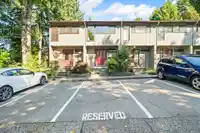
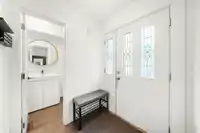
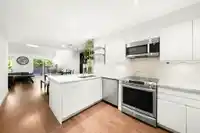
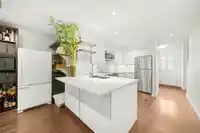
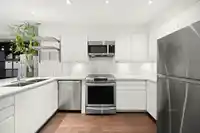
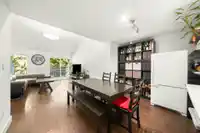
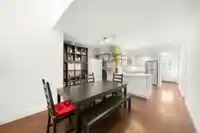
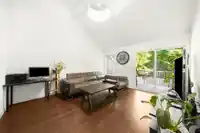
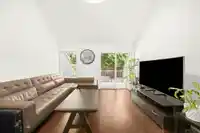
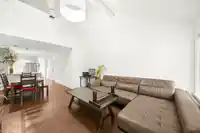
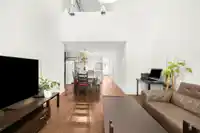
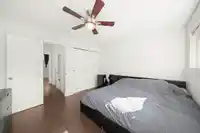
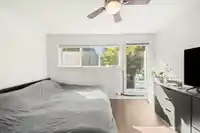
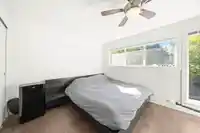
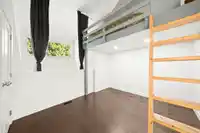
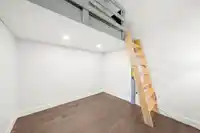
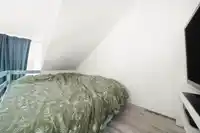
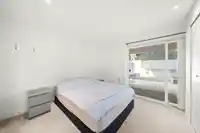
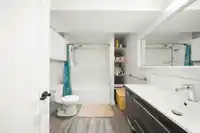
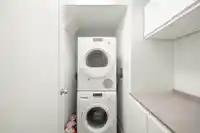
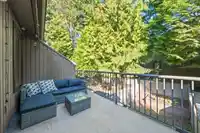
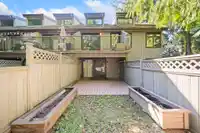
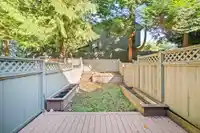
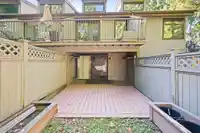
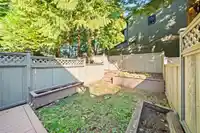
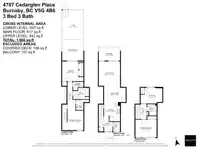
Welcome to Greentree Village—one of Burnaby’s most sought-after family communities. This tastefully updated 3-bedroom, 3-bathroom townhouse offers a bright open-concept layout with a renovated kitchen, refreshed bathrooms, and windows replaced in 2022 for added comfort and efficiency. Enjoy a private two-tiered backyard with upper balcony and walk-out patio…
Features
Property Details
School Catchment
Neighbourhood
Age
- Under 1514%
- 15 to 6465%
- 65 and over21%
Household size
- 1 person18.8%
- 232.6%
- 318.8%
- 419%
- 5 or more10.9%
Language spoken at home
52.3% English mother tongue
Mother tongue, share of 5,335 residents.
How this pocket differs
- notably fewer people living alone than Burnaby South 18.8% vs 30.4%
- notably more 4-person households than Burnaby South 19% vs 12.3%
- more 5+ person households than Burnaby South 10.9% vs 7.7%
- notably fewer Cantonese speakers than Burnaby South 6.6% vs 11.4%
- notably fewer Mandarin speakers than Burnaby South 11.4% vs 17.4%
- Median household income is higher than Metro Vancouver $115,000 vs $90,000
Source: Statistics Canada, Census of Population, 2021. Reproduced and distributed on an "as is" basis with the permission of Statistics Canada.
Monthly Cost Calculator
An estimate only. Canadian semi-annual compounding; excludes utilities, closing costs and BC property transfer tax. 5-year fixed, as of Aug 31
Similar Listings Nearby
3811 GARDEN GROVE DRIVE
4384 GARDEN GROVE DRIVE
103 3633 WILLINGDON AVENUE
TH302 2351 BETA AVENUE
TH307 2351 BETA AVENUE
TH02 2288 ALPHA AVENUE
103 2232 DOUGLAS ROAD
7 5525 HALLEY AVENUE
22 5655 CHAFFEY AVENUE
12 4033 DOMINION STREET
TH17 2345 MADISON AVENUE
25 5298 OAKMOUNT CRESCENT