
 1 / 40 photos








About This Property
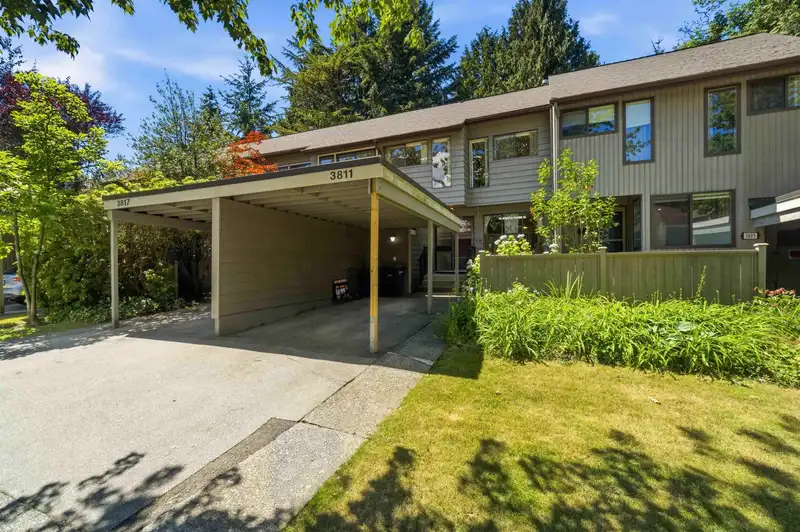
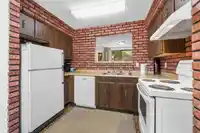
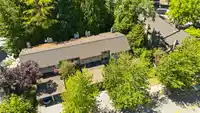
Incredible potential in Greentree Village! This spacious 3-level townhome offers 3 bedrooms,3 bathrooms, and a fantastic, highly functional layout. This total diamond in the rough is an absolute blank canvas waiting for your design ideas, a brand new kitchen, fresh flooring, and a cosmetic updates. Take advantage of the Purchase Plus Improvements program to…
Features
Property Details
School Catchment
Neighbourhood
Age
- Under 1514%
- 15 to 6465%
- 65 and over21%
Household size
- 1 person18.8%
- 232.6%
- 318.8%
- 419%
- 5 or more10.9%
Language spoken at home
52.3% English mother tongue
Mother tongue, share of 5,335 residents.
How this pocket differs
- notably fewer people living alone than Burnaby South 18.8% vs 30.4%
- notably more 4-person households than Burnaby South 19% vs 12.3%
- more 5+ person households than Burnaby South 10.9% vs 7.7%
- notably fewer Cantonese speakers than Burnaby South 6.6% vs 11.4%
- notably fewer Mandarin speakers than Burnaby South 11.4% vs 17.4%
- Median household income is higher than Metro Vancouver $115,000 vs $90,000
Source: Statistics Canada, Census of Population, 2021. Reproduced and distributed on an "as is" basis with the permission of Statistics Canada.
Recent nearby sales
Sold prices are available to registered users. Log in to see what these sold for.
Monthly Cost Calculator
An estimate only. Canadian semi-annual compounding; excludes utilities, closing costs and BC property transfer tax. 5-year fixed, as of Aug 31
Similar Listings Nearby
4707 CEDARGLEN PLACE
4384 GARDEN GROVE DRIVE
103 3633 WILLINGDON AVENUE
TH302 2351 BETA AVENUE
TH307 2351 BETA AVENUE
TH02 2288 ALPHA AVENUE
2609 4730 LOUGHEED HIGHWAY
103 2232 DOUGLAS ROAD
2082 SPRINGER AVENUE
TH17 2345 MADISON AVENUE
22 5655 CHAFFEY AVENUE
7 5525 HALLEY AVENUE