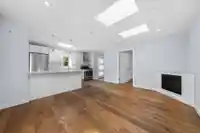
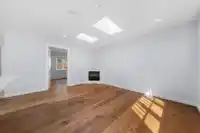
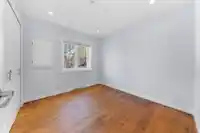
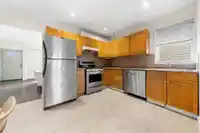
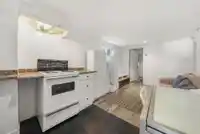
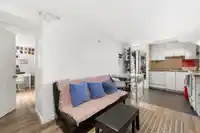
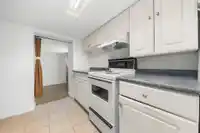
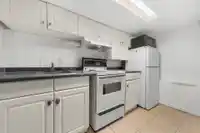
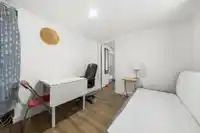
Nestled in the heart of Vancouver, this rare income property sits on a 33 x 110 ft lot with North Shore Mountain views. The character main house, built in 1924, features 3 suites with 5 bedrooms, solid bones, and timeless charm perfect for investors or multi-generational living or a family looking for a home and income. The showstopper? A beautifully built…
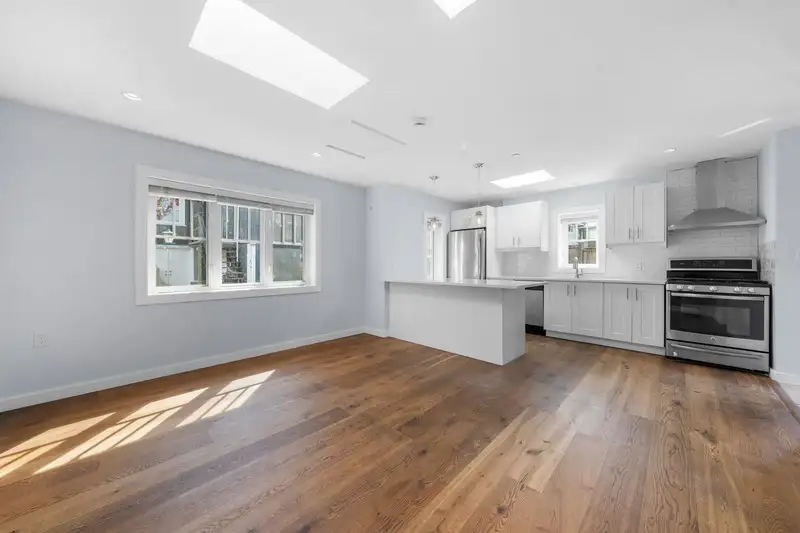
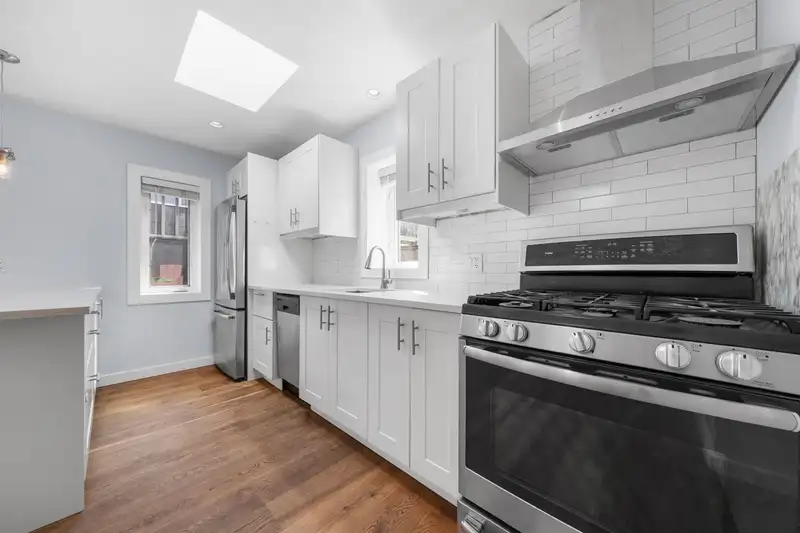
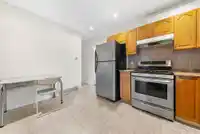
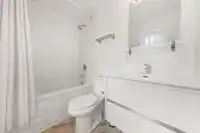
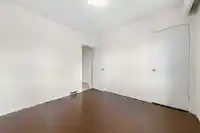
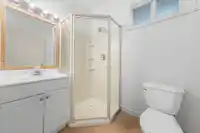
Nestled in the heart of Vancouver, this rare income property sits on a 33 x 110 ft lot with North Shore Mountain views. The character main house, built in 1924, features 3 suites with 5 bedrooms, solid bones, and timeless charm perfect for investors or multi-generational living or a family looking for a home and income. The showstopper? A beautifully built coach house (approx. 2016) offering modern finishes, large bedroom, and potential serious rental upside. With total of 7 bedrooms, 5 bathrooms, 4 kitchens, and in-suite laundry in the coach house, the numbers speak for themselves. Fenced yard and R1-1 zoning round it all out. Steps to shops, parks, and transit and possible development upside in the future? Rarely does a property this versatile hit the market don't let it slip away!
Features
Open
Lane Access
Shopping Nearby
Room measurements17 rooms▸
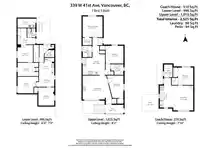
BedroomMain · 11'9 × 11'3
Walk-In ClosetMain · 4'2 × 5'3
BedroomMain · 9'5 × 10'3
BedroomMain · 12'8 × 9'7
KitchenMain · 12'5 × 9'8
Living RoomMain · 13'11 × 16'10
LaundryBelow · 5'9 × 14'4
KitchenBelow · 8'5 × 9'7
Living RoomBelow · 10' × 9'2
BedroomBelow · 9'6 × 11'0
KitchenBelow · 9'8 × 10'
Living RoomBelow · 9'2 × 10'
BedroomBelow · 11'4 × 9'5
BedroomBelow · 10'3 × 11'0
BedroomAbove · 9'10 × 9'2
Living RoomAbove · 14'4 × 13'3
KitchenAbove · 12' × 8'3
Floor plan
🔍 Tap to zoom
Pinch or scroll to zoom · drag to pan · double-tap to reset
Property Details
MLS NumberR3143308
Property TypeSingle Family Residence
Bedrooms7
Bathrooms5
Square Feet2,011
Lot Size3,630 sqft
Year Built1924
HeatingBaseboard, Electric, Forced Air
Days on Market36
StatusActive
Listed ByRoyal LePage Sussex
School Catchment
ElementaryVan Horne
SecondaryJohn Oliver
Neighbourhood
Highlighted area = this home's census tract (StatCan), the boundary the neighbourhood stats describe.
$1,800,000Median home value
$91,000Median household income
58.1%Owner-occupied
27%Single-detached homes
2.4Avg household size
42.4Median age
56.1%Bachelor's degree or higher (25-64)
56.7%Commute under 30 min
59.5%Drive to work
39%Foreign-born residents
5,611Neighbourhood population
Age
Under 1512.1%
15 to 6466.1%
65 and over21.8%
Household size
1 person32.8%
230.6%
316.6%
413.2%
5 or more6.8%
Language spoken at home
52.8% English mother tongue
Cantonese12.9%
Mandarin6.5%
English + other4.3%
Tagalog3.3%
Spanish1.7%
Vietnamese1.6%
All others16.9%
Mother tongue, share of 5,525 residents.
How this pocket differs
more seniors 65+ than Cambie 21.8% vs 17.7%
more Tagalog speakers than Cambie 3.3% vs 2.2%
more Cantonese speakers than Cambie 12.9% vs 10.3%
Median dwelling value is notably higher than Metro Vancouver $1,800,000 vs $1,050,000
Source: Statistics Canada, Census of Population, 2021. Reproduced and distributed on an "as is" basis with the permission of Statistics Canada.
Land & Development
Lot size3,575 sqft
Lot dimensions32 × 110 ft
Lot shapeRectangular
Approximate lot lines (ParcelMap BC)
Zoning, lot dimensions and grade are approximate, from public data, and for reference only — verify with the City / Township of Langley before relying on them.
Monthly Cost Calculator
Estimated monthly cost$7,817
Mortgage payment$7,151
Property tax$506
Home insurance$160
Partner Rates Available
Contact us for preferred mortgage rates
Monthly cost
Estimated monthly$7,817
$1,359,999$1,839,999
21%50%
2.72%6.72%
5 years30 years
$4,816/yr$7,316/yr
$125/mo$195/mo
An estimate only. Canadian semi-annual compounding; excludes utilities, closing costs and BC property transfer tax.
5-year fixed, as of Aug 6

 1 / 40 photos