
 1 / 34 photos







About This Property
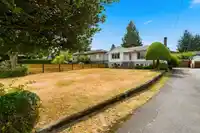
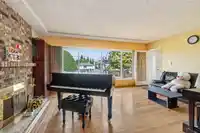
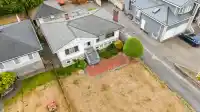
Welcome to this well-located family home in a desirable Burnaby neighborhood. Offering over 2000sq. ft. of living space, the home features a 2 kitchens, 4 bedrooms, 2 bathrooms and a carport, with a practical layout suitable for comfortable family living. The property also offers excellent long-term potential for renovation, investment or future…
Features
Property Details
School Catchment
Neighbourhood
Age
- Under 1512.1%
- 15 to 6466.1%
- 65 and over21.8%
Household size
- 1 person34.3%
- 223.6%
- 314.7%
- 415%
- 5 or more12.4%
Language spoken at home
38.9% English mother tongue
Mother tongue, share of 5,120 residents.
How this pocket differs
- more seniors 65+ than Burnaby North 21.8% vs 17.3%
- notably more 5+ person households than Burnaby North 12.4% vs 7.1%
- notably more Tagalog speakers than Burnaby North 8.1% vs 1.6%
- notably more Vietnamese speakers than Burnaby North 3.3% vs 1.4%
- fewer Mandarin speakers than Burnaby North 6.2% vs 8.7%
Source: Statistics Canada, Census of Population, 2021. Reproduced and distributed on an "as is" basis with the permission of Statistics Canada.
Land & Development
Within a provincially designated Transit-Oriented Area, this lot may support up to 3 FAR / 8 storeys regardless of base zoning. Provincial minimums and approximate — municipal rezoning, servicing and parking standards still apply.
Zoning, lot dimensions and grade are approximate, from public data, and for reference only — verify with the City / Township of Langley before relying on them.
Recent nearby sales
Sold prices are available to registered users. Log in to see what these sold for.
Monthly Cost Calculator
An estimate only. Canadian semi-annual compounding; excludes utilities, closing costs and BC property transfer tax. 5-year fixed, as of Oct 22
Similar Listings Nearby
5225 WOODSWORTH STREET
5558 LAUREL STREET
4729 CANADA WAY
5298 SCHOU STREET
3570 DOUGLAS ROAD
5275 SCHOU STREET
5512 DOMINION STREET
5269 DOMINION STREET
5499 MANOR STREET
5745 LAUREL STREET
4263 ATLEE AVENUE
4460 ATLEE AVENUE