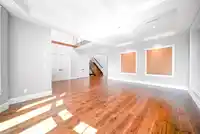
Situated on a beautifully landscaped 9,100 sq ft south-facing lot, this exceptional custom-built residence offers 4,000 sq ft of luxurious living space across three levels. Radiant heating, AC, HRV, backup generator, exterior freshly painted and 10' ceilings both main and upper levels, which is hard to find. High-end gas-equipped kitchen, elegant hardwood…
Situated on a beautifully landscaped 9,100 sq ft south-facing lot, this exceptional custom-built residence offers 4,000 sq ft of luxurious living space across three levels. Radiant heating, AC, HRV, backup generator, exterior freshly painted and 10' ceilings both main and upper levels, which is hard to find. High-end gas-equipped kitchen, elegant hardwood floors, refined stone accents, and meticulous craftsmanship in every room. All bedrooms have private en-suite, providing exceptional comfort and privacy. The primary bedroom with a personal balcony overlooking the garden. Generous backyard, separate-entry basement, and powered lane-access gate. Close to shopping, recreation, and top-rated schools—an excellent choice for luxury living in a prime location.
Features
Vaulted Ceiling(s)
Balcony
Private Yard
Additional Parking
Garage Double
Lane Access
Garage Door Opener
Shopping Nearby
Room measurements12 rooms▸
FoyerMain · 16' × 10'
Living RoomMain · 15' × 21'
Family RoomMain · 15' × 16'
KitchenMain · 15' × 20'
KitchenMain · 7' × 9'
BedroomMain · 15' × 15'
Primary BedroomAbove · 16' × 21'
BedroomAbove · 15' × 16'
BedroomAbove · 15' × 15'
BedroomAbove · 11' × 12'
Living RoomBelow · 15' × 23'
BedroomBelow · 12' × 15'
Floor plan
🔍 Tap to zoom
Pinch or scroll to zoom · drag to pan · double-tap to reset
Property Details
MLS NumberR3160535
Property TypeSingle Family Residence
Bedrooms6
Bathrooms6.5
Square Feet4,000
Lot Size9,156 sqft
Year Built2016
Parking Spaces2
HeatingNatural Gas, Radiant
Days on Market4
StatusActive
Listed ByNu Stream Realty Inc.
School Catchment
ElementaryTwelfth
SecondaryCariboo Hill
Neighbourhood
Highlighted area = this home's census tract (StatCan), the boundary the neighbourhood stats describe.
$900,000Median home value
$78,500Median household income
49.6%Owner-occupied
10%Single-detached homes
2.5Avg household size
35.2Median age
39.4%Bachelor's degree or higher (25-64)
44.3%Commute under 30 min
70.1%Drive to work
58.3%Foreign-born residents
6,095Neighbourhood population
Age
Under 1514.8%
15 to 6473.7%
65 and over11.4%
Household size
1 person28.7%
231.6%
316%
413.3%
5 or more10.4%
Language spoken at home
28.6% English mother tongue
Mandarin10.9%
Cantonese9.4%
Tagalog7.8%
English + other7%
Punjabi3%
Spanish1.9%
All others31.4%
Mother tongue, share of 6,095 residents.
How this pocket differs
fewer seniors 65+ than Burnaby East 11.4% vs 16.2%
more people living alone than Burnaby East 28.8% vs 21.5%
fewer 4-person households than Burnaby East 13.3% vs 16.8%
notably fewer Punjabi speakers than Burnaby East 3% vs 5.1%
more Tagalog speakers than Burnaby East 7.8% vs 5.7%
Source: Statistics Canada, Census of Population, 2021. Reproduced and distributed on an "as is" basis with the permission of Statistics Canada.
Land & Development
Lot size9,156 sqft
Lot dimensions50 × 184 ft
Lot shapeRectangular
Approximate lot lines (ParcelMap BC)
Zoning, lot dimensions and grade are approximate, from public data, and for reference only — verify with the City / Township of Langley before relying on them.
Recent nearby sales
Sold prices are available to registered users. Log in to see what these sold for.

 1 / 40 photos