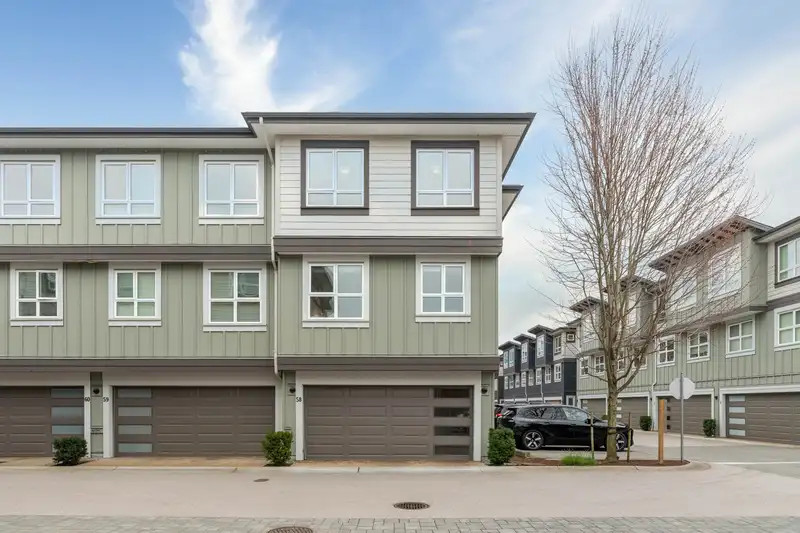
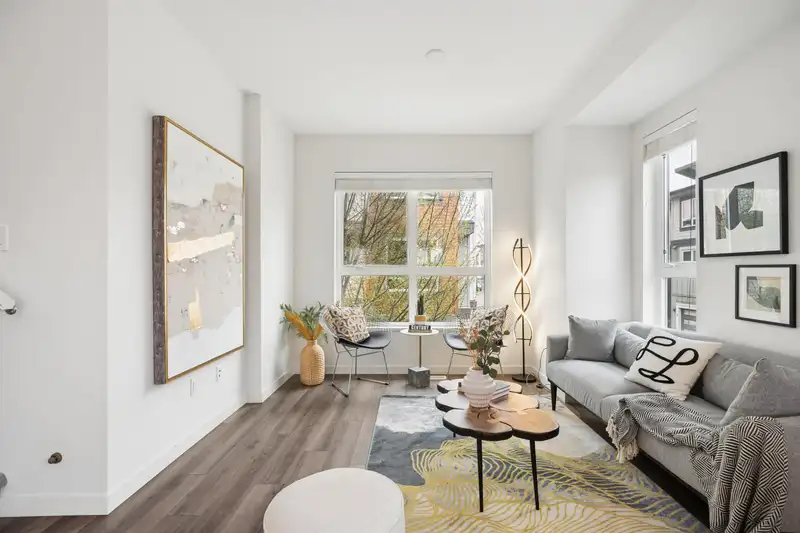
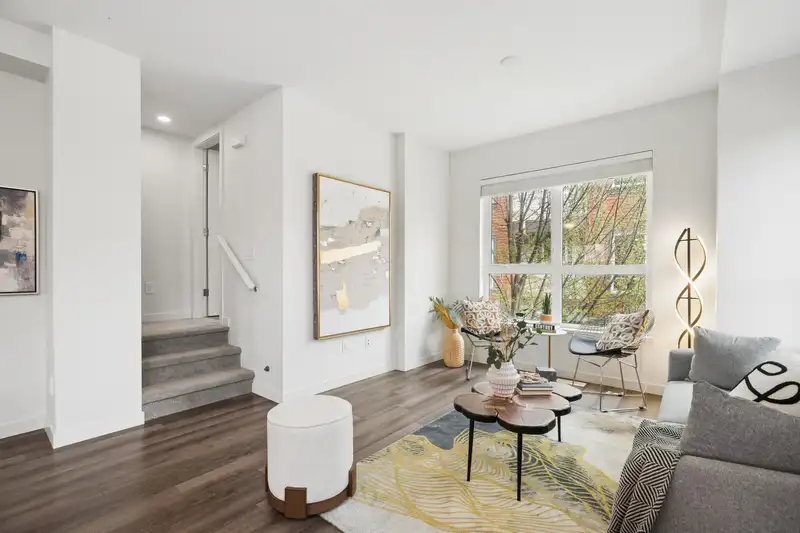
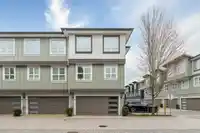
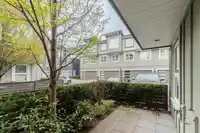
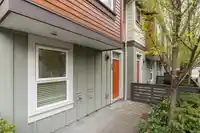
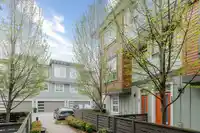
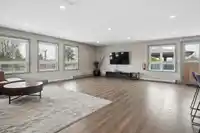
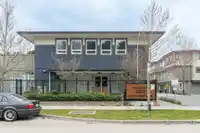
Welcome to Northview Estate in Richmond! This bright 1,412 sqft, 3bed/3bath corner townhouse offers a highly functional layout with stunning East, South, and West exposures. Inside, stay perfectly comfortable year-round with super Energy-Efficient GEOTHERMAL Central AC. Set within a new master-planned community along the Fraser River, this family-friendly…
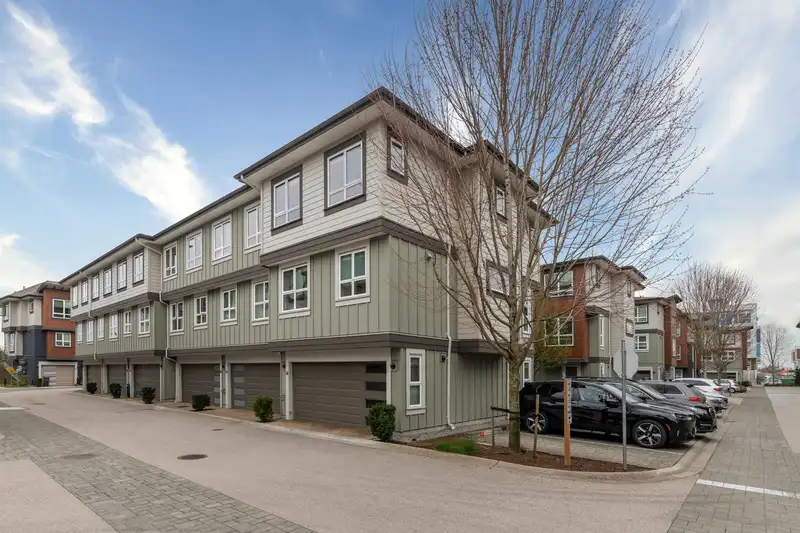
Welcome to Northview Estate in Richmond! This bright 1,412 sqft, 3bed/3bath corner townhouse offers a highly functional layout with stunning East, South, and West exposures. Inside, stay perfectly comfortable year-round with super Energy-Efficient GEOTHERMAL Central AC. Set within a new master-planned community along the Fraser River, this family-friendly area features two new PARKS and a DAYCARE CENTRE. Enjoy immediate access to the dyke trail, plus unmatched convenience with Costco, Bridgeport Skytrain, and Oak Street Bridge just minutes away. A huge bonus is the rare double side-by-side garage equipped with EV charging. LOW $455/mo strata fee (water/sewer included). Riverside luxury meets urban convenience! CALL NOW for your Private Showing! *OPENHOUSE 2-4PM this Sat(4/18)&Sun(4/19)*
Features
Playground
Private Yard
Garage Double
Rear Access
Asphalt
Concrete
Garage Door Opener
Shopping Nearby
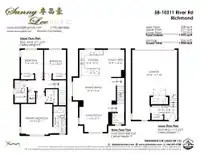
Room measurements8 rooms▸
Living RoomMain · 9'11 × 11'5
Dining RoomMain · 9'6 × 17'
KitchenMain · 9'3 × 10'5
NookMain · 8'5 × 10'9
Primary BedroomAbove · 12'1 × 12'5
BedroomAbove · 8'10 × 9'4
BedroomAbove · 8'8 × 9'4
FoyerBelow · 5'8 × 10'2
Floor plan
🔍 Tap to zoom
Pinch or scroll to zoom · drag to pan · double-tap to reset
Property Details
MLS NumberR3110646
Property TypeTownhouse
Bedrooms3
Bathrooms2.5
Square Feet1,412
Year Built2020
Parking Spaces2
HeatingGeothermal, Heat Pump
Strata Fee$455.19/mo
Days on Market144
StatusActive
Listed ByRE/MAX City Realty
School Catchment
ElementaryTait
SecondaryCambie
Neighbourhood
Highlighted area = this home's census tract (StatCan), the boundary the neighbourhood stats describe.
$1,100,000Median home value
$102,000Median household income
74.8%Owner-occupied
35.9%Single-detached homes
2.9Avg household size
38Median age
43.6%Bachelor's degree or higher (25-64)
61.9%Commute under 30 min
80.4%Drive to work
58.1%Foreign-born residents
3,586Neighbourhood population
Age
Under 1513.9%
15 to 6472%
65 and over14.1%
Household size
1 person19.6%
229.4%
320%
415.9%
5 or more15.1%
Language spoken at home
32.7% English mother tongue
Cantonese22.9%
Mandarin9.6%
English + other7.1%
Punjabi6.3%
Tagalog5.7%
Vietnamese2%
All others13.7%
Mother tongue, share of 3,580 residents.
How this pocket differs
fewer seniors 65+ than Richmond 14.1% vs 20%
notably more 5+ person households than Richmond 15.2% vs 9.2%
fewer people living alone than Richmond 19.7% vs 25.1%
notably more Punjabi speakers than Richmond 6.3% vs 2.4%
notably fewer Mandarin speakers than Richmond 9.6% vs 21.1%
notably more Tagalog speakers than Richmond 5.7% vs 3.7%
Source: Statistics Canada, Census of Population, 2021. Reproduced and distributed on an "as is" basis with the permission of Statistics Canada.
Monthly Cost Calculator
Estimated monthly cost$6,348
Mortgage payment$5,501
Strata fee$455
Property tax$332
Home insurance$60
Partner Rates Available
Contact us for preferred mortgage rates
Monthly cost
Estimated monthly$6,348
$1,019,900$1,379,900
8%50%
2.85%6.85%
5 years30 years
$3,183/yr$4,783/yr
$45/mo$75/mo
$360/mo$550/mo
An estimate only. Canadian semi-annual compounding; excludes utilities, closing costs and BC property transfer tax.
5-year fixed, as of Sep 1

 1 / 40 photos