
 1 / 19 photos





About This Property
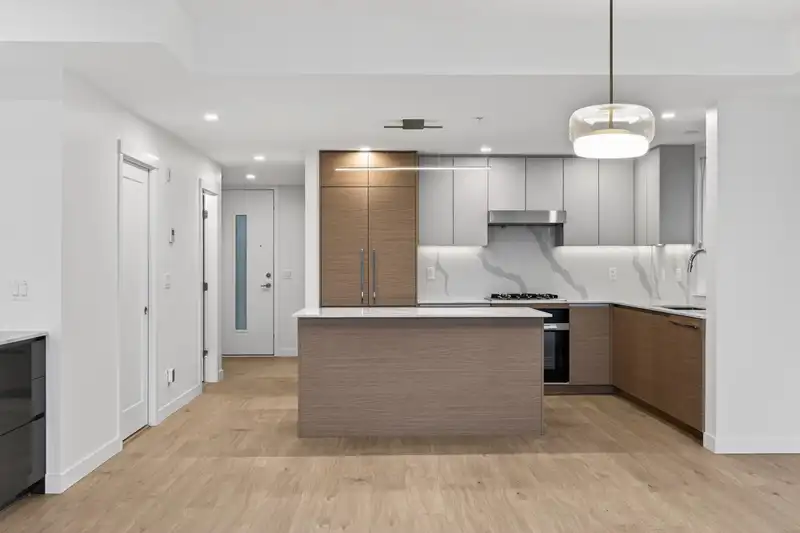
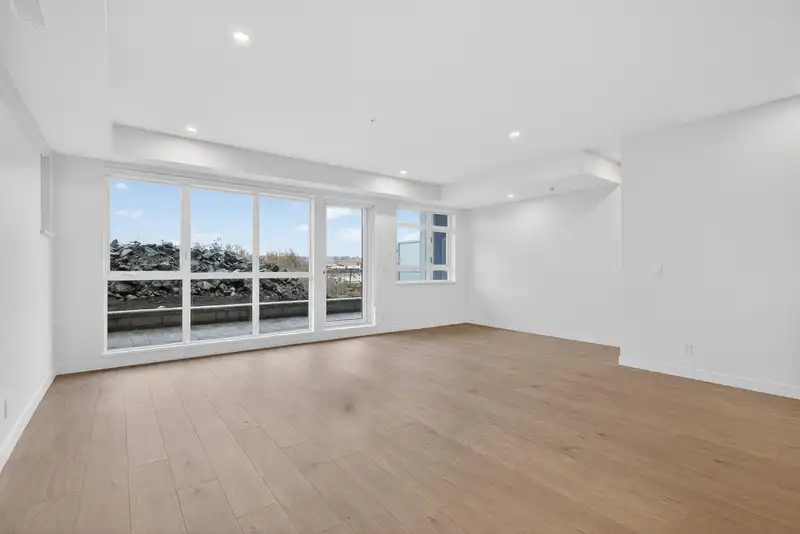
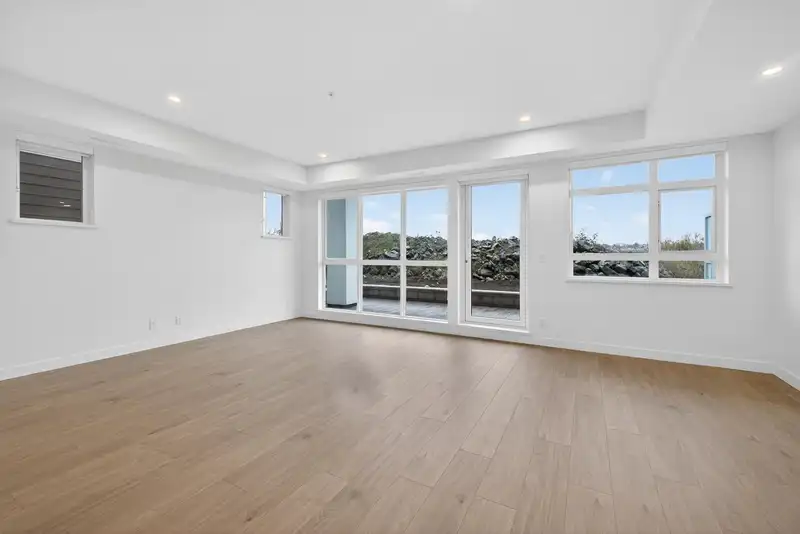
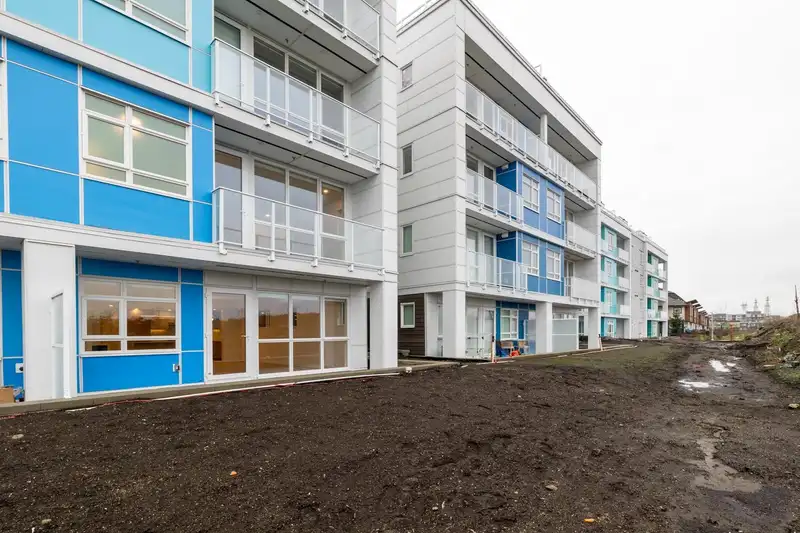
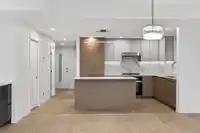
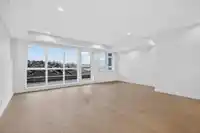
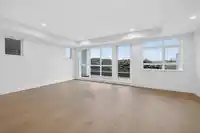
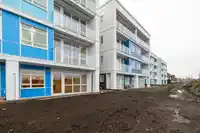
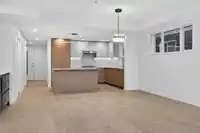
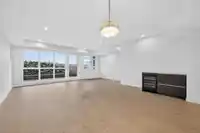
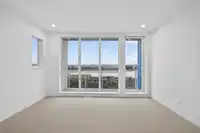
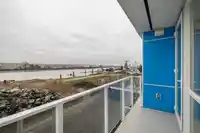
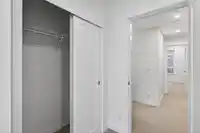
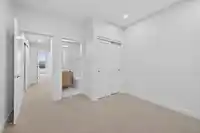
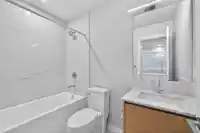
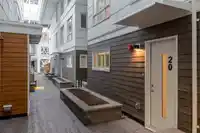
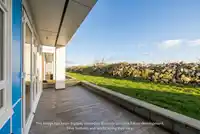
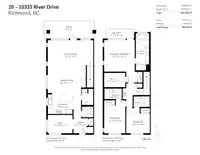
Introducing one of Parc Portofino's most exceptional residences, perfectly positioned to capture breathtaking Fraser River and North Shore mountain views. This premium home showcases upgraded finishes, expansive living spaces, generously sized bedrooms, and a rare private double garage. Designed for both everyday comfort and effortless entertaining, the…
Features
Property Details
School Catchment
Neighbourhood
Age
- Under 1513.9%
- 15 to 6472%
- 65 and over14.1%
Household size
- 1 person19.6%
- 229.4%
- 320%
- 415.9%
- 5 or more15.1%
Language spoken at home
32.7% English mother tongue
Mother tongue, share of 3,580 residents.
How this pocket differs
- fewer seniors 65+ than Richmond 14.1% vs 20%
- notably more 5+ person households than Richmond 15.2% vs 9.2%
- fewer people living alone than Richmond 19.7% vs 25.1%
- notably more Punjabi speakers than Richmond 6.3% vs 2.4%
- notably fewer Mandarin speakers than Richmond 9.6% vs 21.1%
- notably more Tagalog speakers than Richmond 5.7% vs 3.7%
Source: Statistics Canada, Census of Population, 2021. Reproduced and distributed on an "as is" basis with the permission of Statistics Canada.
Recent nearby sales
Sold prices are available to registered users. Log in to see what these sold for.
Monthly Cost Calculator
An estimate only. Canadian semi-annual compounding; excludes utilities, closing costs and BC property transfer tax. 5-year fixed, as of Sep 2
Similar Listings Nearby
26 10333 RIVER DRIVE
76 10333 RIVER DRIVE
37 10333 RIVER DRIVE
84 10311 RIVER DRIVE
58 10311 RIVER DRIVE
65 10311 RIVER DRIVE
28 10233 RIVER DRIVE
58 10199 RIVER DRIVE
70 10199 RIVER DRIVE
80 10199 RIVER DRIVE
82 10199 RIVER DRIVE
18 3033 SHELL ROAD