
 1 / 38 photos








About This Property
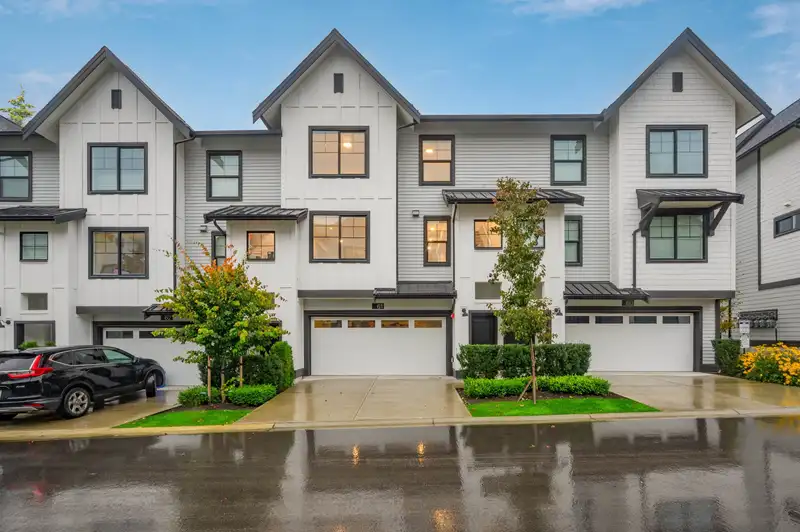
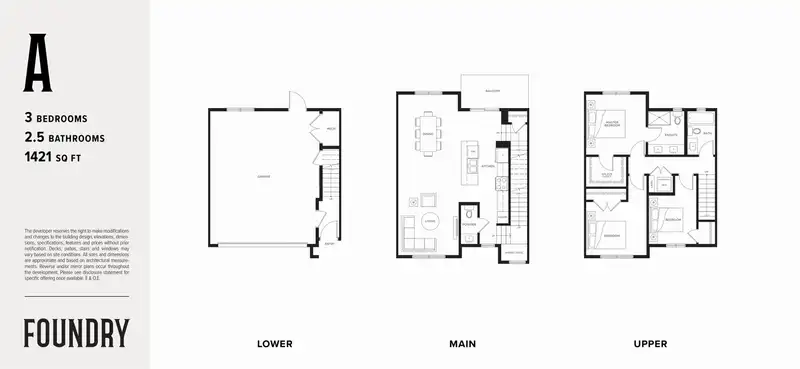
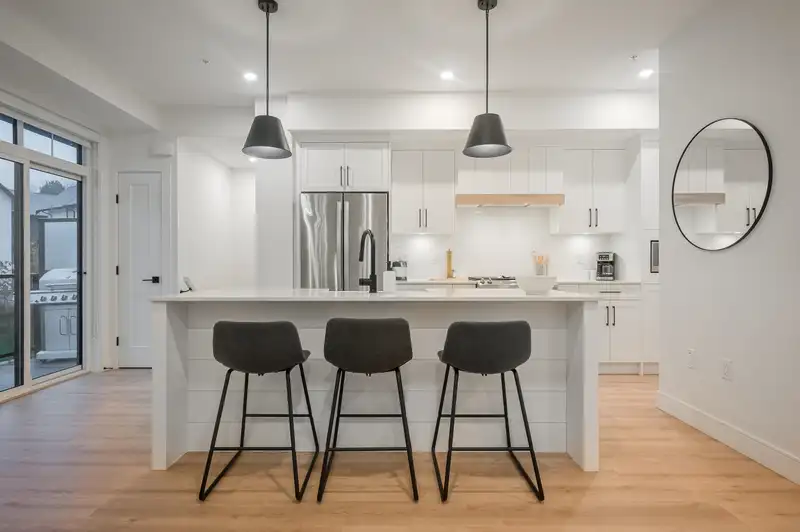
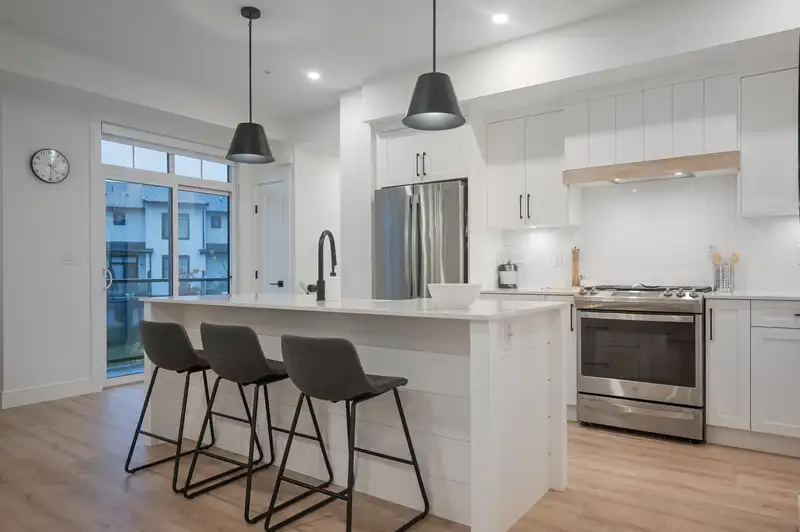
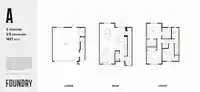
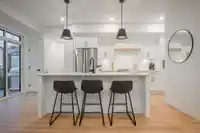
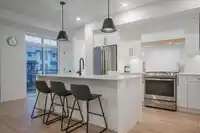
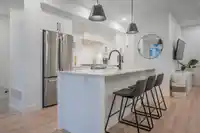
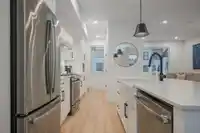
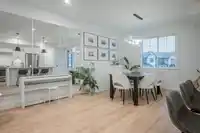
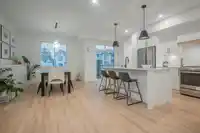
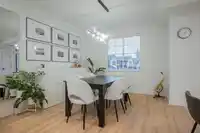
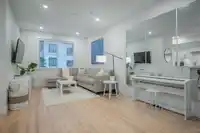
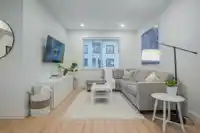
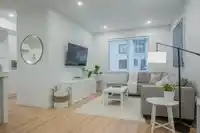
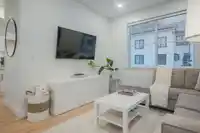
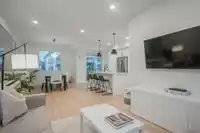
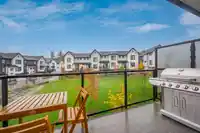
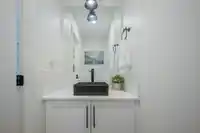
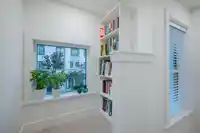
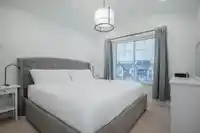
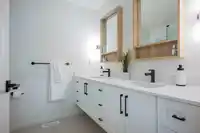
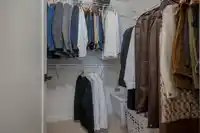
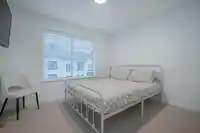
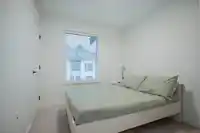
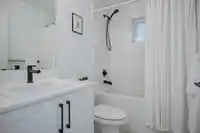
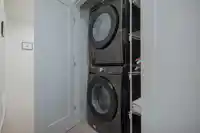
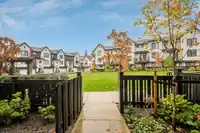
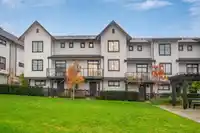
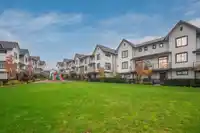
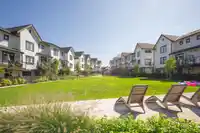
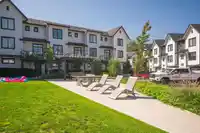
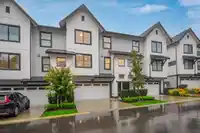
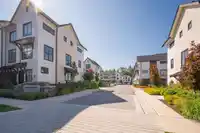
Foundry~ Quality built by award winning Miracon presents this 1421 sq ft 3 bdrm, 3 bthrm home in a great location of the complex & a zip around the corner to everything! Main flr boasts an open concept, maximizing flr space w/ a large dining area. Kitchen has great touches w/ a pantry, island w/ seating for 3, apron front sink, task lighting & S/S…
Features
Property Details
School Catchment
Neighbourhood
Age
- Under 1521.8%
- 15 to 6468.4%
- 65 and over9.9%
Household size
- 1 person11.1%
- 221.3%
- 320.2%
- 426.6%
- 5 or more20.8%
Language spoken at home
61.9% English mother tongue
Mother tongue, share of 5,805 residents.
How this pocket differs
- notably more 5+ person households than Willoughby Heights 20.8% vs 11.6%
- notably fewer people living alone than Willoughby Heights 11.1% vs 19.3%
- more 4-person households than Willoughby Heights 26.6% vs 20.4%
- notably fewer Korean speakers than Willoughby Heights 4.6% vs 9.7%
- notably more Punjabi speakers than Willoughby Heights 4.8% vs 3%
- Median household income is higher than Metro Vancouver $132,000 vs $90,000
- Median dwelling value is higher than Metro Vancouver $1,290,000 vs $1,050,000
Source: Statistics Canada, Census of Population, 2021. Reproduced and distributed on an "as is" basis with the permission of Statistics Canada.
Recent nearby sales
Sold prices are available to registered users. Log in to see what these sold for.
Monthly Cost Calculator
An estimate only. Canadian semi-annual compounding; excludes utilities, closing costs and BC property transfer tax. 5-year fixed, as of Oct 19
Similar Listings Nearby
38 7967 197 STREET
104 7967 197 STREET
67 7967 197 STREET
44 7960 197 STREET
38 7960 197 STREET
42 7960 197 STREET
50 7960 197 STREET
33 7640 197 STREET
16 7640 197 STREET
53 19897 75A AVENUE
53 19501 74 AVENUE
23 8161 201 STREET