
 1 / 24 photos

About This Property
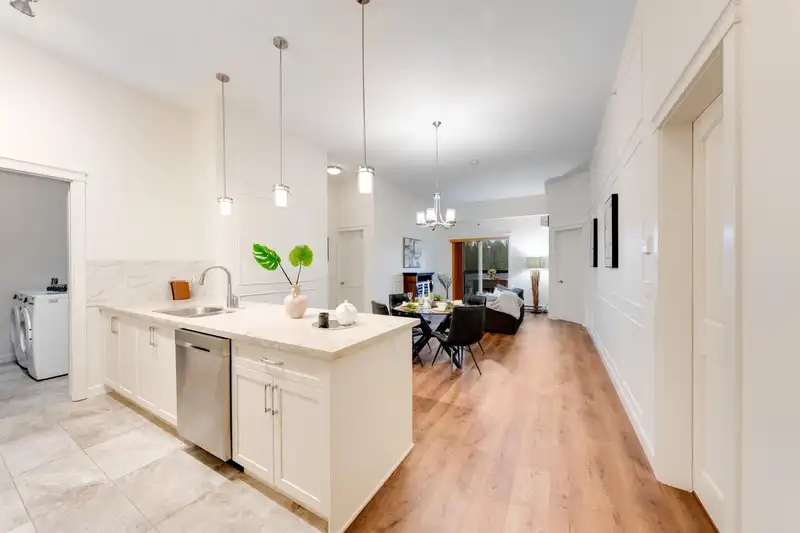
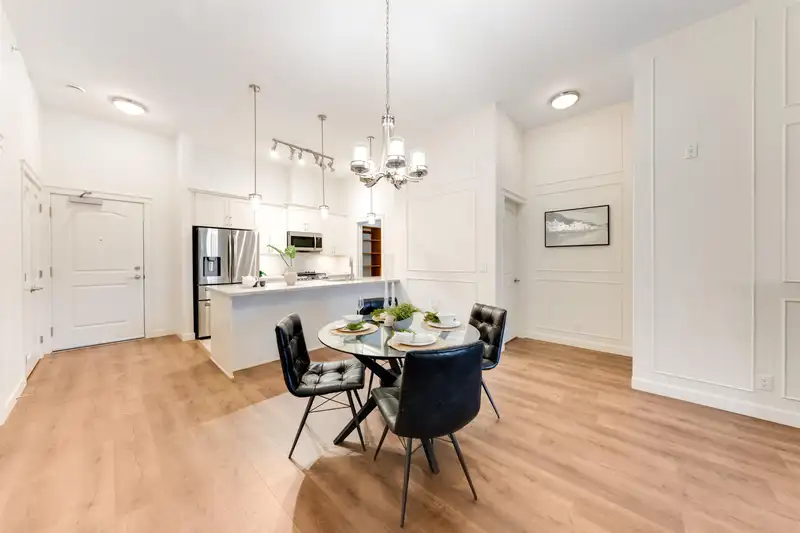
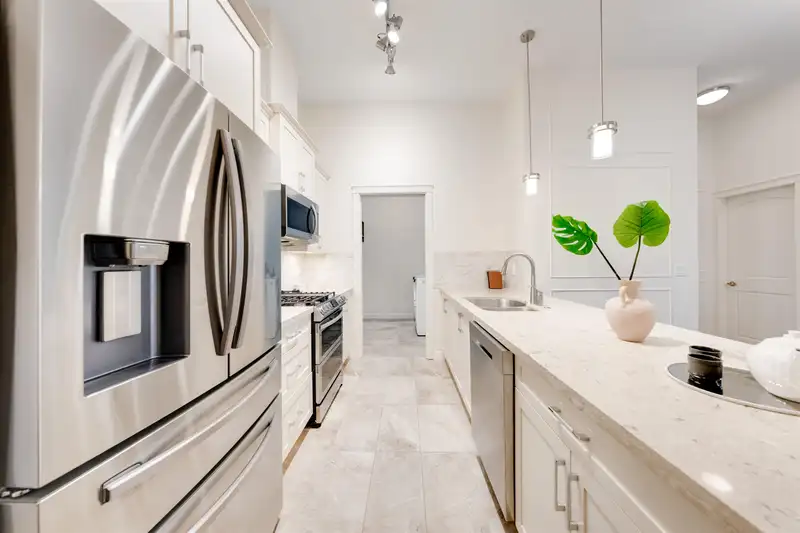
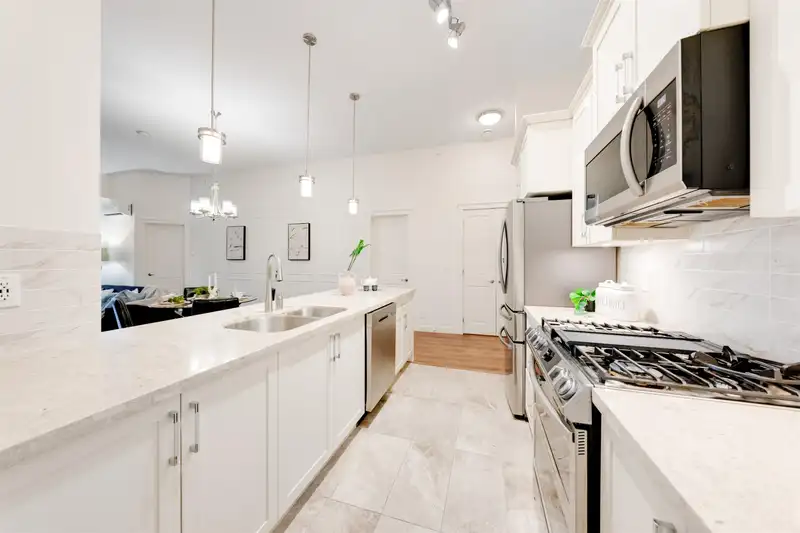
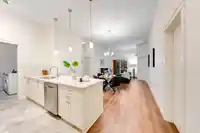
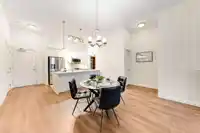
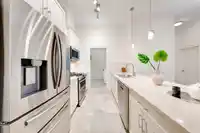
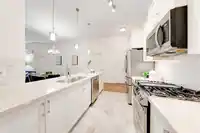
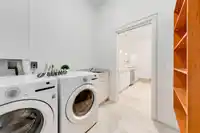
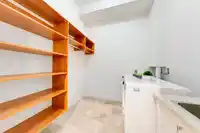
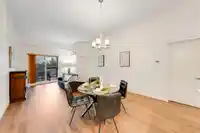
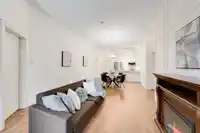
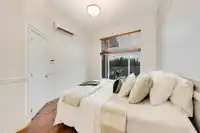
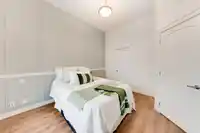
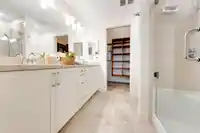
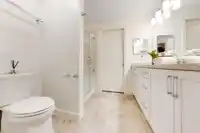
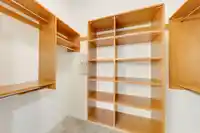
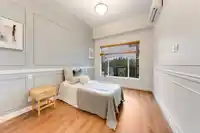
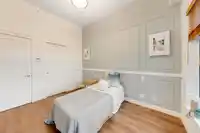
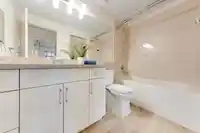
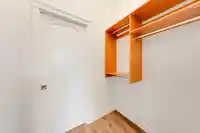
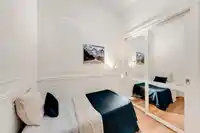
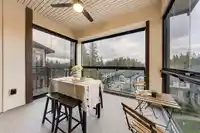
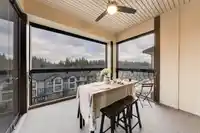
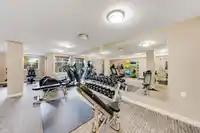
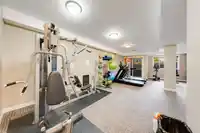
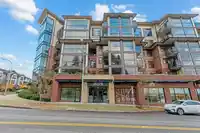
East facing PENTHOUSE offering exceptional design and premium features throughout. This Jr. 3bed + 2bath home offers a bright square glass solarium with a gas connection perfect for year round BBQs. The interior has been thoughtfully enhanced with a custom feature wall design and a complete repaint elevating the home’s modern aesthetic. Gourmet appliances…
Features
Property Details
School Catchment
Neighbourhood
Age
- Under 1520.3%
- 15 to 6467.9%
- 65 and over11.9%
Household size
- 1 person21.2%
- 235%
- 320.3%
- 418%
- 5 or more5.6%
Language spoken at home
53.4% English mother tongue
Mother tongue, share of 7,755 residents.
How this pocket differs
- notably fewer 5+ person households than Willoughby Heights 5.6% vs 11.6%
- notably more Korean speakers than Willoughby Heights 18.2% vs 9.7%
- Median dwelling value is notably lower than Metro Vancouver $700,000 vs $1,050,000
Source: Statistics Canada, Census of Population, 2021. Reproduced and distributed on an "as is" basis with the permission of Statistics Canada.
Location
Recent nearby sales
Sold prices are available to registered users. Log in to see what these sold for.
Monthly Cost Calculator
Similar Listings Nearby
309 20376 86 AVENUE
608 20376 86 AVENUE
208 20376 86 AVENUE
408 20376 86 AVENUE
210 20376 86 AVENUE
601 8538 203A STREET
109 20367 85 AVENUE
302 8561 203A STREET
403 8561 203A STREET
302 20367 85 AVENUE
405 8561 203A STREET
207 20325 85 AVENUE