
 1 / 23 photos











About This Property
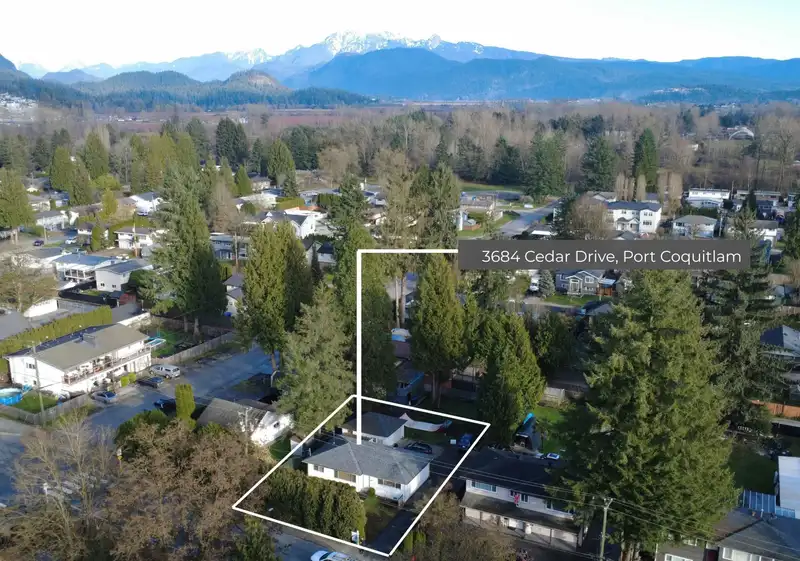
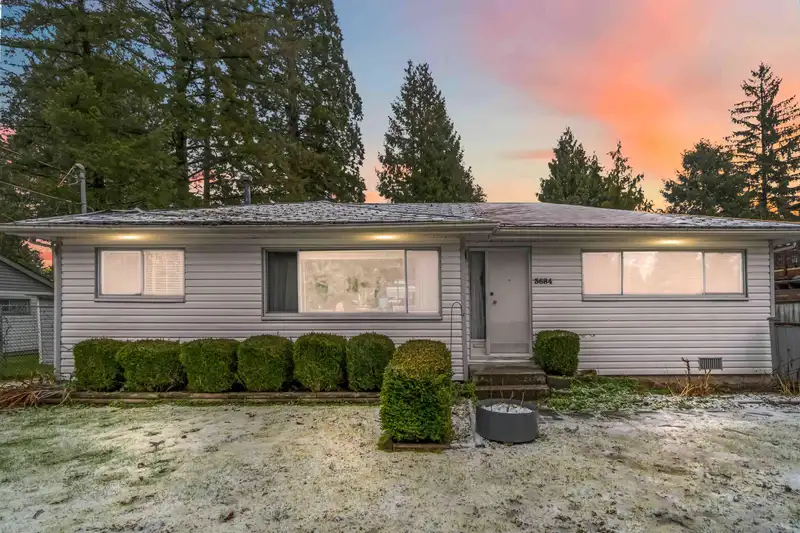
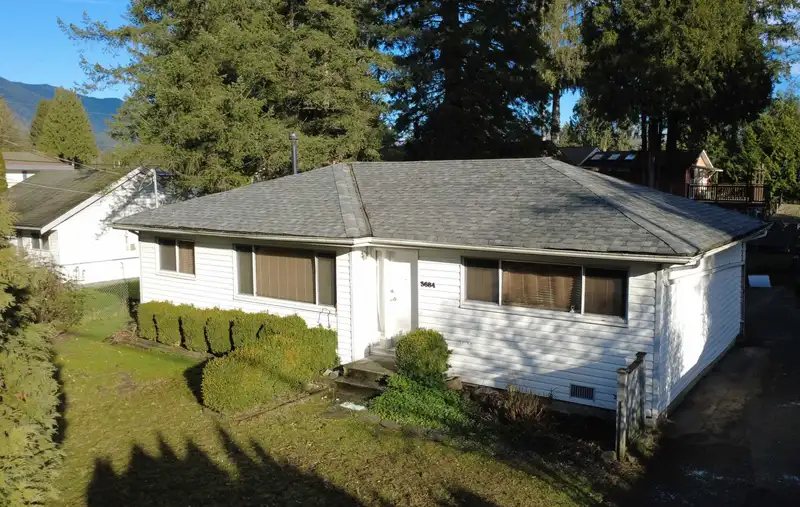
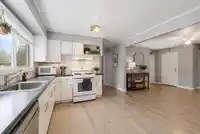
Why Pay Maintance Fees? Welcome to this charming rancher nestled in the heart of Lincoln Park, offering over 7,135 sqft of potential with a 67-foot frontage & 425 sqft shop. Whether you're looking for a place to call home, a rental property, or a development lot, this property covers it all! Ability to build up to 4 units under SSMUH - check with city. The…
Features
Property Details
School Catchment
Neighbourhood
Age
- Under 1517.8%
- 15 to 6468.8%
- 65 and over13.4%
Household size
- 1 person19%
- 232.8%
- 321.8%
- 418.3%
- 5 or more8.2%
Language spoken at home
62.8% English mother tongue
Mother tongue, share of 5,730 residents.
How this pocket differs
- notably more Punjabi speakers than Port Coquitlam 3% vs 1.6%
- more Korean speakers than Port Coquitlam 3.7% vs 2.6%
- Median household income is higher than Metro Vancouver $112,000 vs $90,000
Source: Statistics Canada, Census of Population, 2021. Reproduced and distributed on an "as is" basis with the permission of Statistics Canada.
Land & Development
Zoning, lot dimensions and grade are approximate, from public data, and for reference only — verify with the City / Township of Langley before relying on them.
Recent nearby sales
Sold prices are available to registered users. Log in to see what these sold for.
Monthly Cost Calculator
An estimate only. Canadian semi-annual compounding; excludes utilities, closing costs and BC property transfer tax. 5-year fixed, as of Aug 28
Similar Listings Nearby
3778 KILLARNEY STREET
3786 KILLARNEY STREET
3944 INVERNESS STREET
3365 FOREST GROVE PLACE
828 HUBER DRIVE
4027 JOSEPH PLACE
773 PRAIRIE AVENUE
1066 BERNARD PLACE
1067 PRAIRIE AVENUE
619 SWANSON PLACE
707 OMINECA AVENUE
1130 BLUE HERON CRESCENT