
 1 / 28 photos


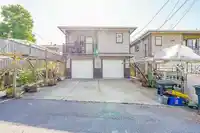
About This Property
EXCELLENT INVESTMENT OPPORTUNITY! Built in 2012, this Spacious and Versatile home generates an impressive $7,800 in monthly rental income! The main residence features 4 BED 2 BATH, High Ceiling foyer, Bright Open Concept living space, Laminate flooring Updated in 2025. Additional accommodations include a 2-Bedroom Suite, a spacious 1-Bedroom Suite with…
Features
Property Details
School Catchment
Neighbourhood
Age
- Under 1512%
- 15 to 6464.3%
- 65 and over23.7%
Household size
- 1 person30%
- 228.9%
- 315.1%
- 414.9%
- 5 or more11.1%
Language spoken at home
40.4% English mother tongue
Mother tongue, share of 7,160 residents.
How this pocket differs
- more seniors 65+ than Burnaby South 23.7% vs 18.5%
- more 5+ person households than Burnaby South 11.1% vs 7.7%
- more 4-person households than Burnaby South 14.9% vs 12.3%
- notably fewer Mandarin speakers than Burnaby South 7.7% vs 17.4%
- more Punjabi speakers than Burnaby South 3.1% vs 2.3%
- more Cantonese speakers than Burnaby South 14.4% vs 11.4%
- Median dwelling value is higher than Metro Vancouver $1,300,000 vs $1,050,000
Source: Statistics Canada, Census of Population, 2021. Reproduced and distributed on an "as is" basis with the permission of Statistics Canada.
Sales History
| Date | Sale Price |
|---|---|
| Feb 8, 2023 | $1,440,000 |
Source: BC Assessment (public records).
Land & Development
Within a provincially designated Transit-Oriented Area, this lot may support up to 3 FAR / 8 storeys regardless of base zoning. Provincial minimums and approximate — municipal rezoning, servicing and parking standards still apply.
Zoning, lot dimensions and grade are approximate, from public data, and for reference only — verify with the City / Township of Langley before relying on them.
Recent nearby sales
Sold prices are available to registered users. Log in to see what these sold for.
Monthly Cost Calculator
An estimate only. Canadian semi-annual compounding; excludes utilities, closing costs and BC property transfer tax. 5-year fixed, as of Nov 2
Similar Listings Nearby
3481 DIEPPE DRIVE
2898 NATAL STREET
3788 LINWOOD STREET
3778 NITHSDALE STREET
3350 E 8 AVENUE
3660 E 22ND AVENUE
3826 GLENDALE STREET
3430 MONS DRIVE
4137 DOMINION STREET
3939 BOUNDARY ROAD
3466 E 2ND AVENUE
3713 KINCAID STREET