
 1 / 31 photos


About This Property
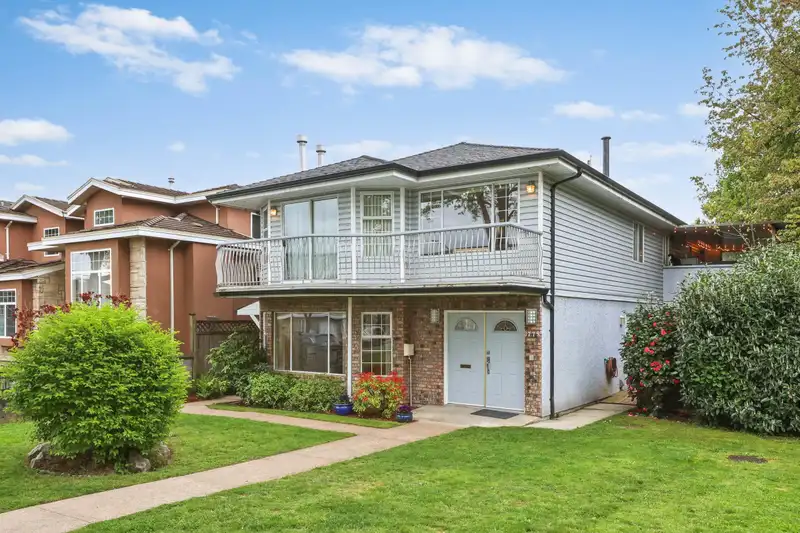
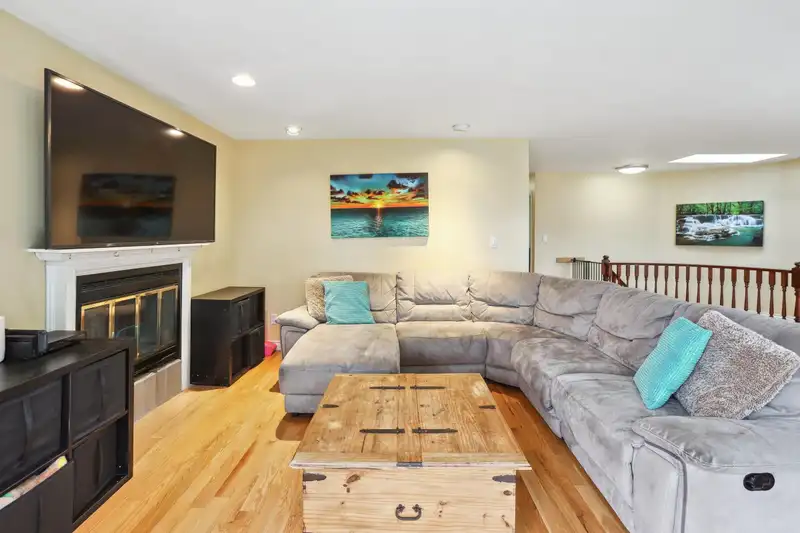
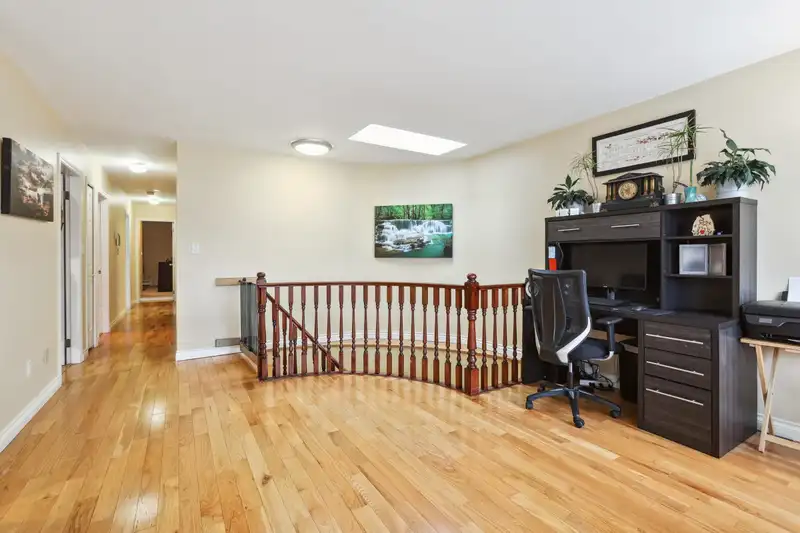
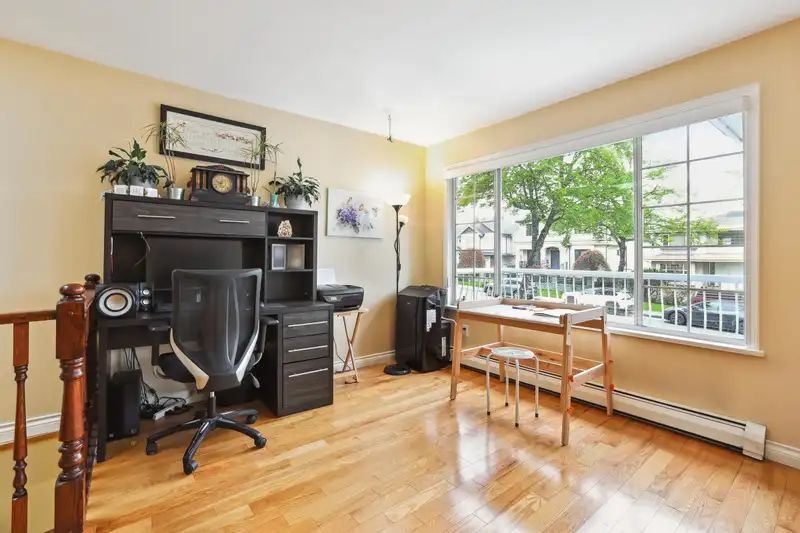
Listen to the CREEK in this great family home with 3 bedroom(possibly 4 bed, if dining room converted) on the main floor. Hardwood floors on the main. Double drywall on the suite ceiling for extra sound proofing. Doors widen for wheel chair accessibility in the basement suite. Large PRIVATE covered balcony, BIG ground floor wooden patio and LARGE deck…
Property Details
School Catchment
Neighbourhood
Age
- Under 1512%
- 15 to 6464.3%
- 65 and over23.7%
Household size
- 1 person30%
- 228.9%
- 315.1%
- 414.9%
- 5 or more11.1%
Language spoken at home
40.4% English mother tongue
Mother tongue, share of 7,160 residents.
How this pocket differs
- more seniors 65+ than Burnaby South 23.7% vs 18.5%
- more 5+ person households than Burnaby South 11.1% vs 7.7%
- more 4-person households than Burnaby South 14.9% vs 12.3%
- notably fewer Mandarin speakers than Burnaby South 7.7% vs 17.4%
- more Punjabi speakers than Burnaby South 3.1% vs 2.3%
- more Cantonese speakers than Burnaby South 14.4% vs 11.4%
- Median dwelling value is higher than Metro Vancouver $1,300,000 vs $1,050,000
Source: Statistics Canada, Census of Population, 2021. Reproduced and distributed on an "as is" basis with the permission of Statistics Canada.
Land & Development
Zoning, lot dimensions and grade are approximate, from public data, and for reference only — verify with the City / Township of Langley before relying on them.
Recent nearby sales
Sold prices are available to registered users. Log in to see what these sold for.
Monthly Cost Calculator
An estimate only. Canadian semi-annual compounding; excludes utilities, closing costs and BC property transfer tax. 5-year fixed, as of Oct 30
Similar Listings Nearby
3788 LINWOOD STREET
3896 ELMWOOD STREET
3822 KINCAID STREET
3713 KINCAID STREET
3939 BOUNDARY ROAD
3660 E 22ND AVENUE
3826 GLENDALE STREET
3481 DIEPPE DRIVE
3678 E 25TH AVENUE
3873 PINE STREET
3895 GLENDALE STREET
3662 E 25TH AVENUE