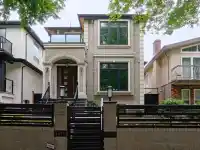
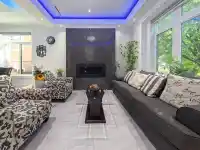
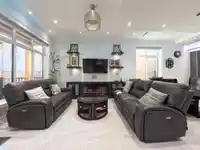
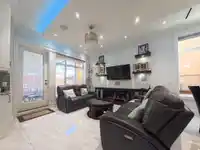
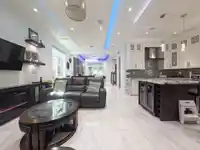
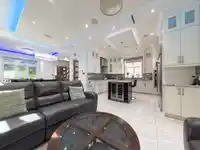
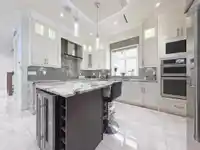
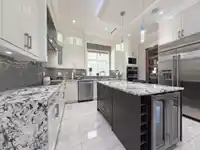
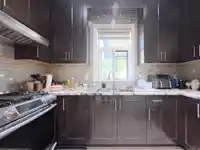
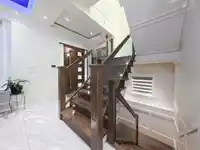
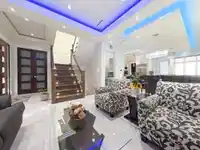
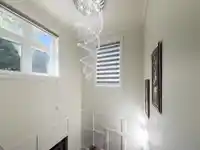
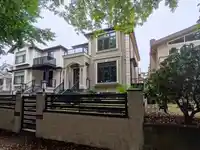
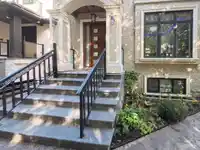
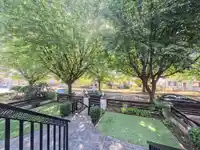
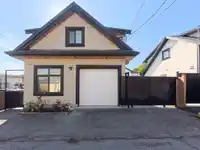
Convenient South Vancouver Location – Builder’s Own Custom Home! This beautifully crafted home offers everything you’re looking for: an open-concept main floor w/ soaring 10-ft ceilings, gourmet + wok kitchens, high-end JENN-AIR appliances & custom millwork throughout — all with exceptional attention to detail. 4 generously sized bedrooms on upper floor.…
Convenient South Vancouver Location – Builder’s Own Custom Home! This beautifully crafted home offers everything you’re looking for: an open-concept main floor w/ soaring 10-ft ceilings, gourmet + wok kitchens, high-end JENN-AIR appliances & custom millwork throughout — all with exceptional attention to detail. 4 generously sized bedrooms on upper floor. The basement features a 2-bedroom legal suite + a separate 1-bedroom suite,offering excellent rental income/space for extended family. A 1-bedroom laneway house adds even more value as a mortgage helper. AC, Radian heat & home audio system with speakers throughout. Walter Moberly Elementary and David Thompson Secondary catchment. Easy access to Richmond/DT/Oakridge and Metrotown. Don't miss out - Call today to book your private showing !
Features
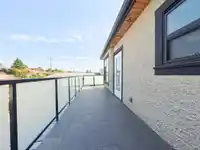
Balcony
Carport Single
Garage Single
Room measurements16 rooms▸
FoyerMain · 5'8 × 9'9
Living RoomMain · 12'7 × 12'11
Dining RoomMain · 10'2 × 12'11
Family RoomMain · 11'6 × 11'4
KitchenMain · 13'11 × 11'4
Wok KitchenMain · 5'3 × 10'8
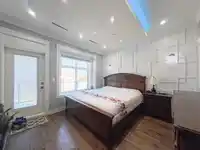
Primary BedroomAbove · 11'3 × 12'2
BedroomAbove · 8'11 × 10'2
BedroomAbove · 9'0 × 12'8
BedroomAbove · 7'8 × 8'8
KitchenBelow · 13'0 × 10'6
BedroomBelow · 8'0 × 7'0
BedroomBelow · 9'8 × 10'6
DenBelow · 7'3 × 10'5
Flex RoomBelow · 11'4 × 10'5
LaundryBelow · 4'6 × 10'5
Floor plan
🔍 Tap to zoom
Pinch or scroll to zoom · drag to pan · double-tap to reset
Property Details
MLS NumberR3079192
Property TypeSingle Family Residence
Bedrooms6
Bathrooms5
Square Feet2,670
Lot Size3,791.7 sqft
Year Built2016
Parking Spaces2
HeatingRadiant
StatusClosed
Listed ByRE/MAX Real Estate Services
School Catchment
ElementaryMoberly
SecondaryDavid Thompson
Neighbourhood
Highlighted area = this home's census tract (StatCan), the boundary the neighbourhood stats describe.
$1,600,000Median home value
$91,000Median household income
47.6%Owner-occupied
17.5%Single-detached homes
3.2Avg household size
37.2Median age
34.7%Bachelor's degree or higher (25-64)
55.1%Commute under 30 min
61.9%Drive to work
58.4%Foreign-born residents
4,519Neighbourhood population
Age
Under 1512.8%
15 to 6471%
65 and over16.2%
Household size
1 person19.1%
222.4%
319.1%
418.4%
5 or more21%
Language spoken at home
25.5% Punjabi mother tongue
English24.2%
Tagalog10.3%
Cantonese9.2%
English + other8.7%
Hindi2.8%
Vietnamese2.8%
All others16.5%
Mother tongue, share of 4,420 residents.
How this pocket differs
fewer Cantonese speakers than South Vancouver 9.2% vs 13.5%
more Tagalog speakers than South Vancouver 10.3% vs 8.2%
more Punjabi speakers than South Vancouver 25.5% vs 20.4%
Median dwelling value is notably higher than Metro Vancouver $1,600,000 vs $1,050,000
Source: Statistics Canada, Census of Population, 2021. Reproduced and distributed on an "as is" basis with the permission of Statistics Canada.
Land & Development
Lot size3,813 sqft
Lot dimensions33 × 115 ft
Lot shapeRectangular
Approximate lot lines (ParcelMap BC)
Zoning, lot dimensions and grade are approximate, from public data, and for reference only — verify with the City / Township of Langley before relying on them.
Recent nearby sales
Sold prices are available to registered users. Log in to see what these sold for.

 1 / 40 photos