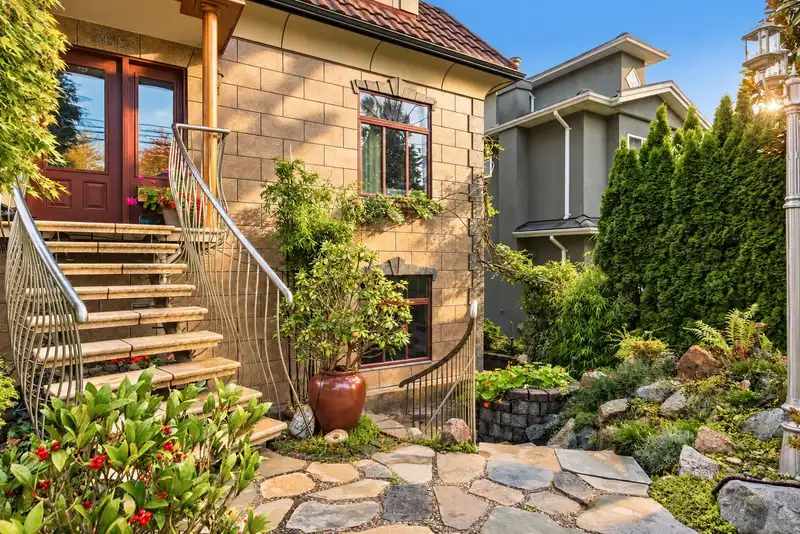
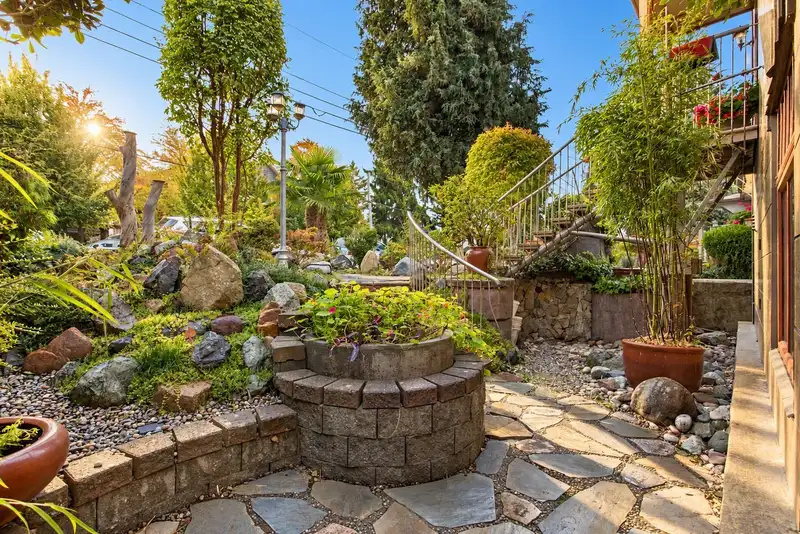
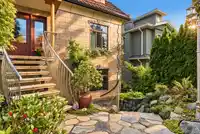
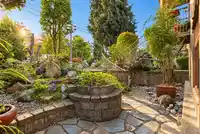
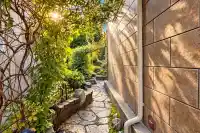
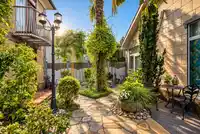
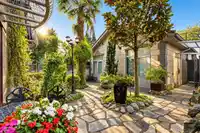
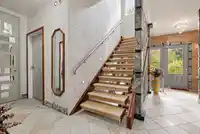
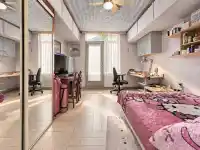
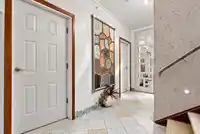
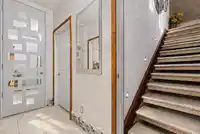
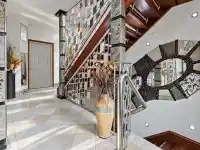
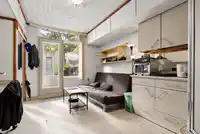
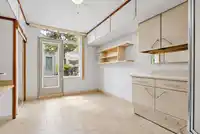
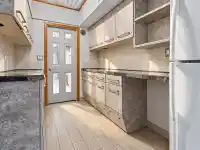
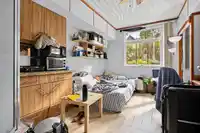
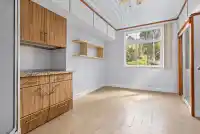
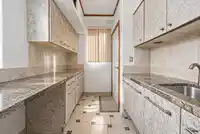
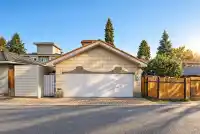
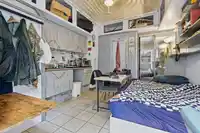
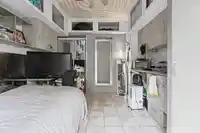
Not your typical income property. Custom-built by the owner/builder for himself, this exceptional QE Park residence reflects an uncompromising commitment to quality, longevity and timeless design. Multiple income-generating micro-suites provide diversified revenue, while premium materials and meticulous craftsmanship set this property apart. Features…
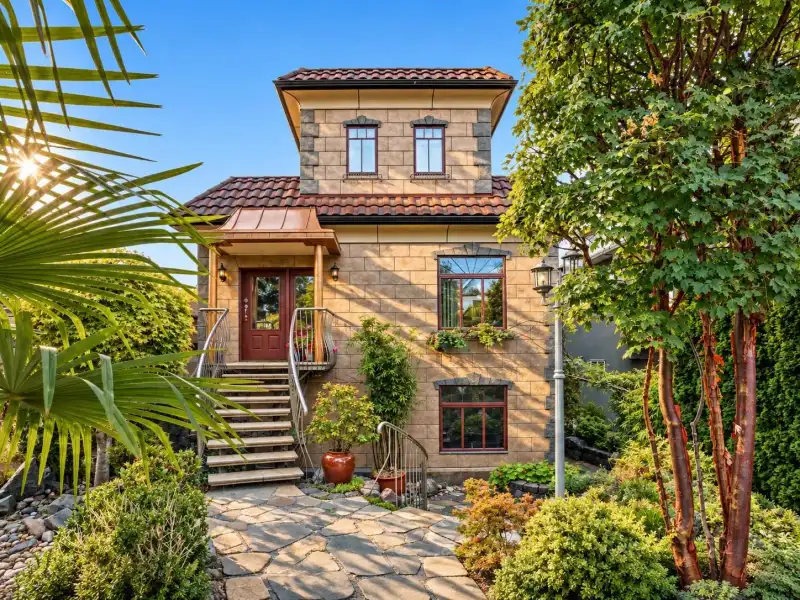
Not your typical income property. Custom-built by the owner/builder for himself, this exceptional QE Park residence reflects an uncompromising commitment to quality, longevity and timeless design. Multiple income-generating micro-suites provide diversified revenue, while premium materials and meticulous craftsmanship set this property apart. Features include Venetian plaster, granite and porcelain finishes, triple-glazed Krypton windows, rainscreen construction, superior soundproofing, double insulation and a 50-year steel roof. Current net income approx. $98,500 with potential to reach $118,800—approximately a 4% cap rate with upside to 4.75%. A rare combination of classical design, thoughtful engineering and durable construction. Owner-builder retiring. By appointment only.
Features
Storage
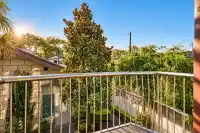
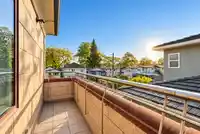
Balcony
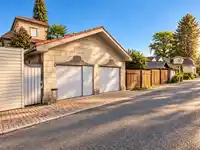
Detached
Rear Access
Paver Block
Room measurements13 rooms▸
BedroomMain · 13'8 × 11'10
BedroomMain · 13'9 × 11'10
BedroomMain · 13'10 × 11'10
FoyerMain · 18' × 8'3
BedroomBelow · 13'8 × 11'10
BedroomBelow · 13'10 × 12'10
BedroomBsmt · 13'10 × 10'9
KitchenBsmt · 10'0 × 6'10
KitchenAbove · 18'5 × 6'10
BedroomAbove · 13'8 × 10'8
BedroomBsmt · 12'6 × 11'10
BedroomBsmt · 12'6 × 11'10
StorageBsmt · 8'11 × 22'6
Floor plan
🔍 Tap to zoom
Pinch or scroll to zoom · drag to pan · double-tap to reset
Property Details
MLS NumberR3172526
Property TypeSingle Family Residence
Bedrooms9
Bathrooms9
Square Feet1,945
Lot Size3,324.38 sqft
Year Built2013
Parking Spaces2
HeatingElectric, Radiant
Days on Market3
StatusActive
Listed BySutton Group - Supreme Realty Corporation
School Catchment
ElementaryBrock
SecondaryJohn Oliver
Neighbourhood
Highlighted area = this home's census tract (StatCan), the boundary the neighbourhood stats describe.
$1,800,000Median home value
$91,000Median household income
58.1%Owner-occupied
27%Single-detached homes
2.4Avg household size
42.4Median age
56.1%Bachelor's degree or higher (25-64)
56.7%Commute under 30 min
59.5%Drive to work
39%Foreign-born residents
5,611Neighbourhood population
Age
Under 1512.1%
15 to 6466.1%
65 and over21.8%
Household size
1 person32.8%
230.6%
316.6%
413.2%
5 or more6.8%
Language spoken at home
52.8% English mother tongue
Cantonese12.9%
Mandarin6.5%
English + other4.3%
Tagalog3.3%
Spanish1.7%
Vietnamese1.6%
All others16.9%
Mother tongue, share of 5,525 residents.
How this pocket differs
more seniors 65+ than Cambie 21.8% vs 17.7%
more Tagalog speakers than Cambie 3.3% vs 2.2%
more Cantonese speakers than Cambie 12.9% vs 10.3%
Median dwelling value is notably higher than Metro Vancouver $1,800,000 vs $1,050,000
Source: Statistics Canada, Census of Population, 2021. Reproduced and distributed on an "as is" basis with the permission of Statistics Canada.
Land & Development
Lot size3,329 sqft
Lot dimensions34 × 98 ft
Lot shapeRectangular
Approximate lot lines (ParcelMap BC)
Zoning, lot dimensions and grade are approximate, from public data, and for reference only — verify with the City / Township of Langley before relying on them.
Recent nearby sales
Sold prices are available to registered users. Log in to see what these sold for.

 1 / 40 photos