
 1 / 31 photos


About This Property
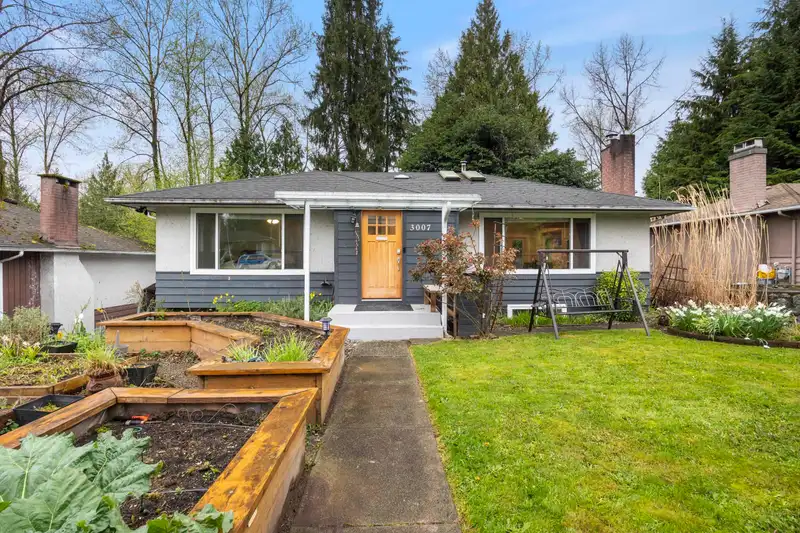
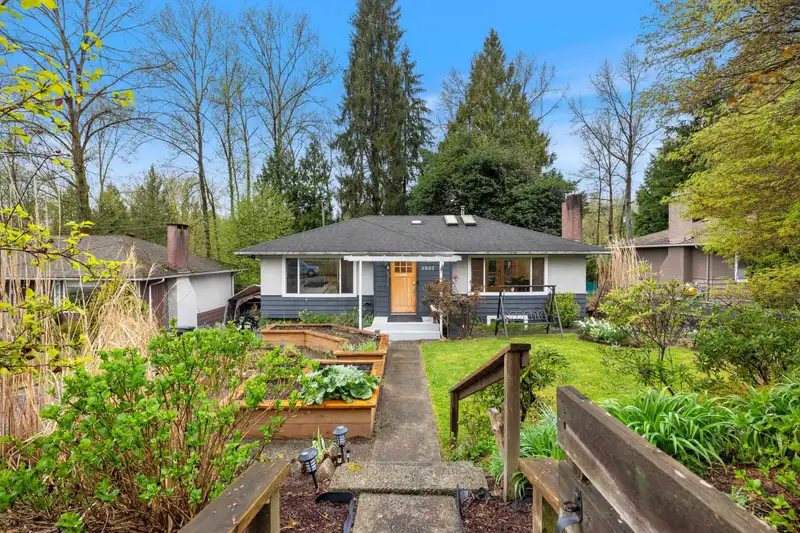
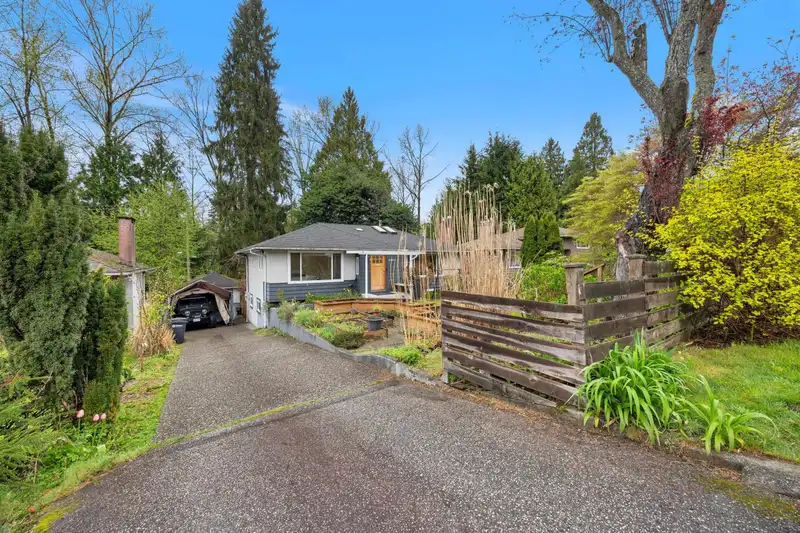
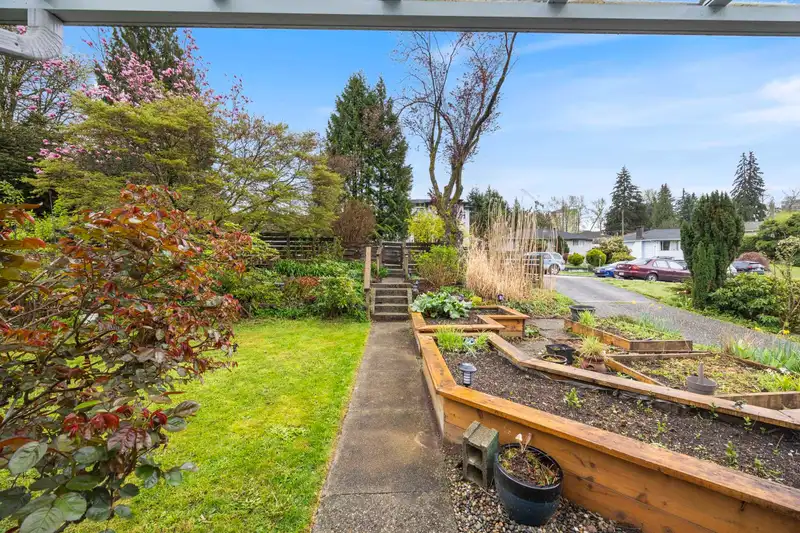
Greenbelt lot in Sullivan Heights! Tucked away on a quiet street, this home offers a number of thoughtful updates including a beautiful kitchen, newer windows, skylights and recessed lighting. The newly reno'd lower level features a spacious primary bedroom, a spa-like ensuite with separate tub and shower, a versatile office or sitting area, and a garden…
Features
Property Details
School Catchment
Neighbourhood
Age
- Under 1515.4%
- 15 to 6470.4%
- 65 and over14.2%
Household size
- 1 person21.7%
- 231.1%
- 320.4%
- 419.6%
- 5 or more7.2%
Language spoken at home
54.6% English mother tongue
Mother tongue, share of 4,910 residents.
How this pocket differs
- more 4-person households than Burnaby North 19.5% vs 13.2%
- fewer people living alone than Burnaby North 21.7% vs 29.8%
- notably more Tagalog speakers than Burnaby North 3% vs 1.6%
- notably fewer Cantonese speakers than Burnaby North 7.6% vs 11.7%
- more Korean speakers than Burnaby North 4.8% vs 3.7%
- Median dwelling value is lower than Metro Vancouver $750,000 vs $1,050,000
Source: Statistics Canada, Census of Population, 2021. Reproduced and distributed on an "as is" basis with the permission of Statistics Canada.
Land & Development
Zoning, lot dimensions and grade are approximate, from public data, and for reference only — verify with the City / Township of Langley before relying on them.
Recent nearby sales
Sold prices are available to registered users. Log in to see what these sold for.
Monthly Cost Calculator
An estimate only. Canadian semi-annual compounding; excludes utilities, closing costs and BC property transfer tax. 5-year fixed, as of Nov 12
Similar Listings Nearby
3057 NOEL DRIVE
9645 DAVID DRIVE
2577 STONEY CREEK PLACE
2525 NORCREST COURT
2475 NORCREST COURT
9986 CASEWELL STREET
525 PERTH AVENUE
521 BROOKMERE AVENUE
529 APPIAN WAY
541 COCHRANE AVENUE
605 VICTOR STREET
569 THOMPSON AVENUE