
 1 / 32 photos















About This Property
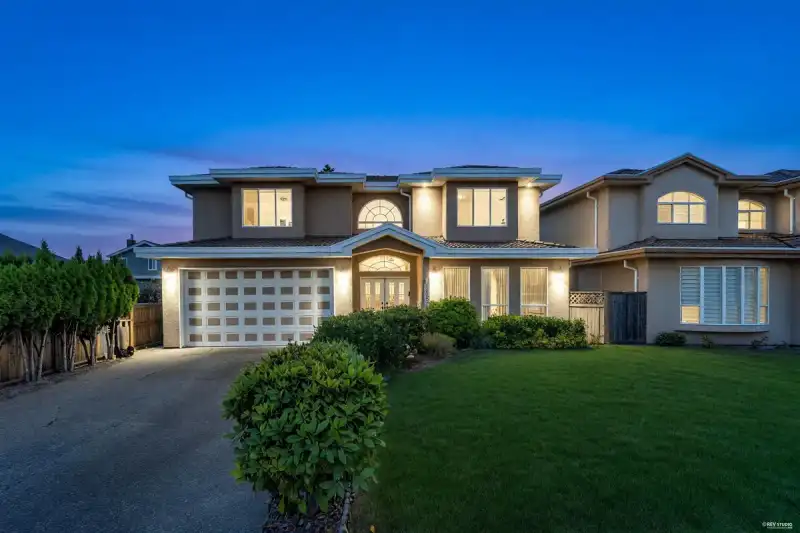
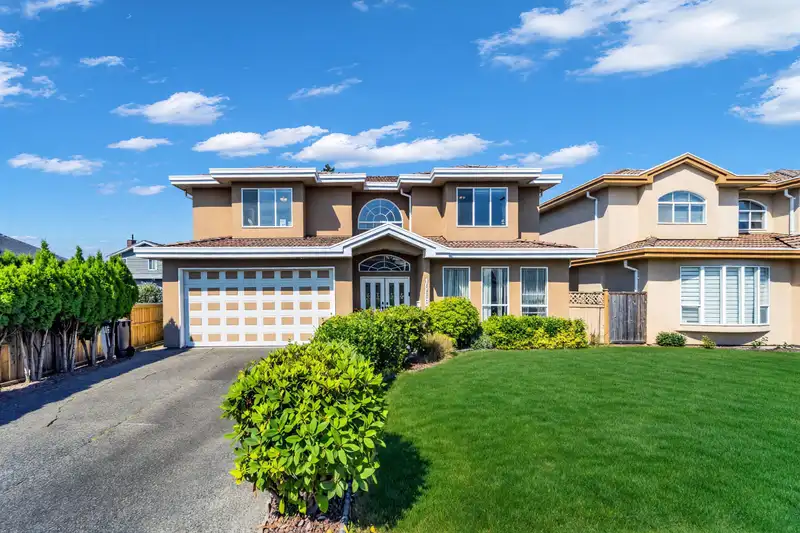
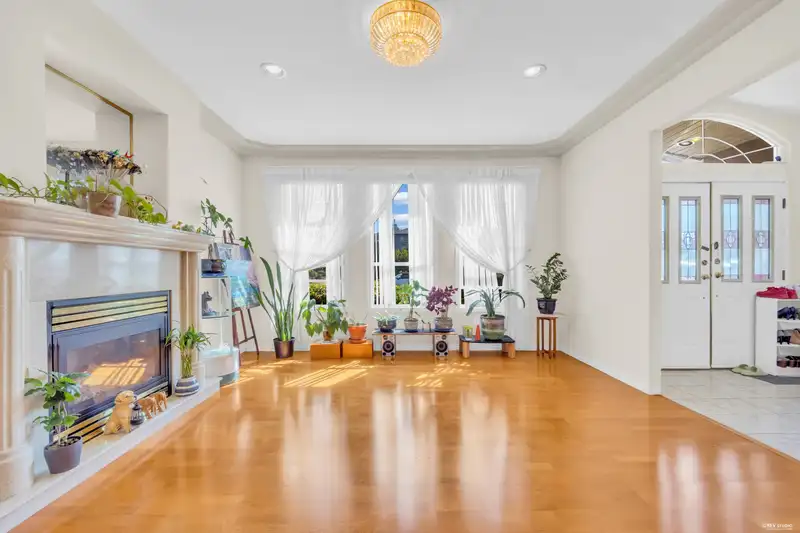
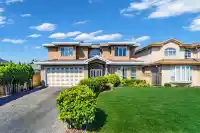
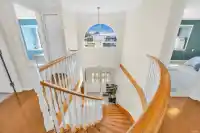
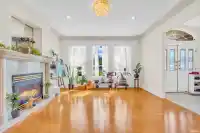
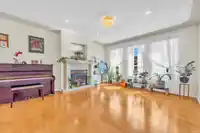
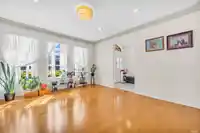
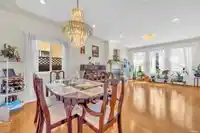
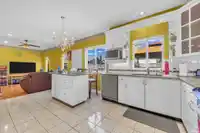
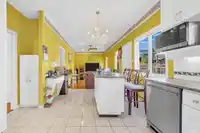
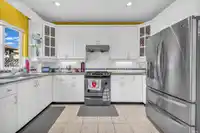
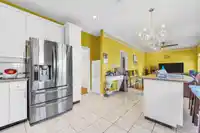
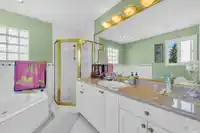
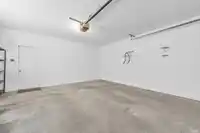
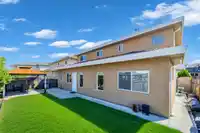
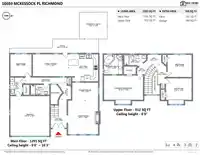
Move-in ready 2-level home in a desirable family-friendly neighbourhood! Featuring 4 bedrooms with 3 upstairs and 1 on the main, 3 bathrooms, 9' ceilings, stainless steel appliances, and a bright, functional layout. Enjoy the sunny southwest-facing backyard with only one neighbouring house, offering added privacy. A fantastic home for growing families!
Features
Property Details
School Catchment
Neighbourhood
Age
- Under 1513.9%
- 15 to 6472%
- 65 and over14.1%
Household size
- 1 person19.6%
- 229.4%
- 320%
- 415.9%
- 5 or more15.1%
Language spoken at home
32.7% English mother tongue
Mother tongue, share of 3,580 residents.
How this pocket differs
- fewer seniors 65+ than Richmond 14.1% vs 20%
- notably more 5+ person households than Richmond 15.2% vs 9.2%
- fewer people living alone than Richmond 19.7% vs 25.1%
- notably more Punjabi speakers than Richmond 6.3% vs 2.4%
- notably fewer Mandarin speakers than Richmond 9.6% vs 21.1%
- notably more Tagalog speakers than Richmond 5.7% vs 3.7%
Source: Statistics Canada, Census of Population, 2021. Reproduced and distributed on an "as is" basis with the permission of Statistics Canada.
Land & Development
Zoning, lot dimensions and grade are approximate, from public data, and for reference only — verify with the City / Township of Langley before relying on them.
Monthly Cost Calculator
Similar Listings Nearby
10635 MCKESSOCK PLACE
10551 BRIDGEPORT ROAD
2271 BAYDALA COURT
10780 RIVER DRIVE
2480 MCLENNAN AVENUE
10331 FINLAYSON DRIVE
2228 MCLEOD AVENUE
10320 CAITHCART ROAD
10291 CAITHCART ROAD
3760 BAMFIELD DRIVE
3580 BARGEN DRIVE
3691 BARGEN DRIVE