
 1 / 10 photos


About This Property
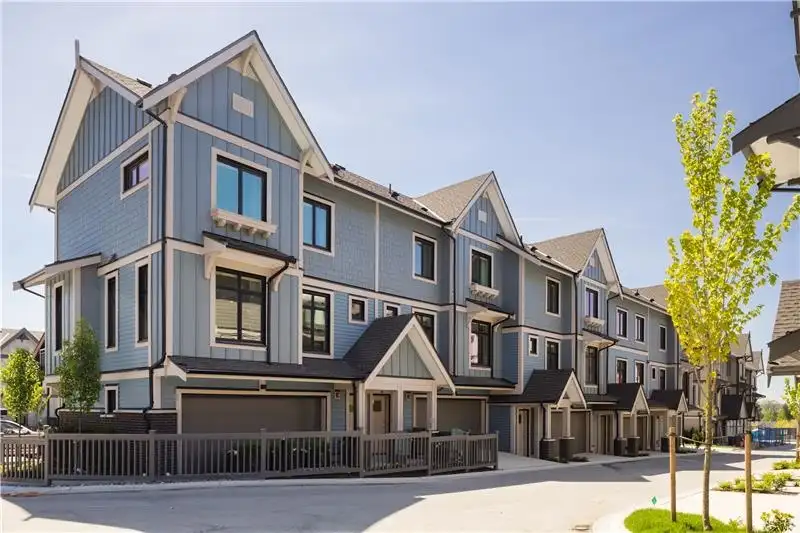
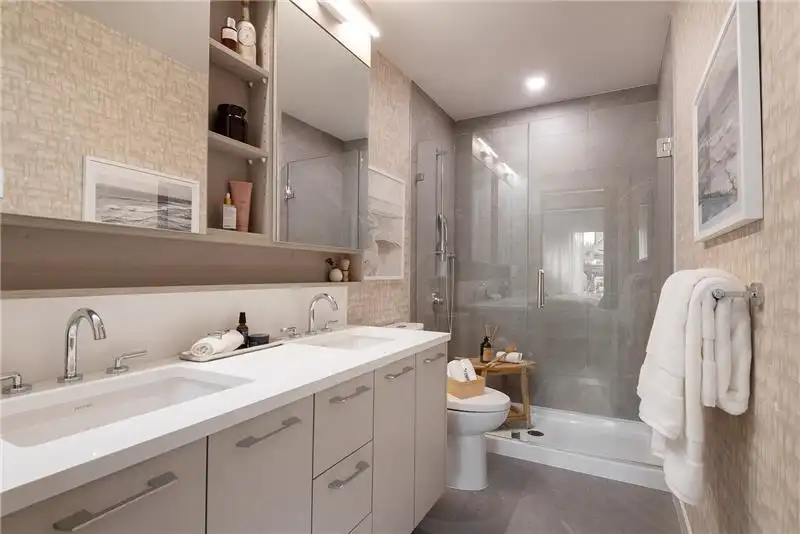
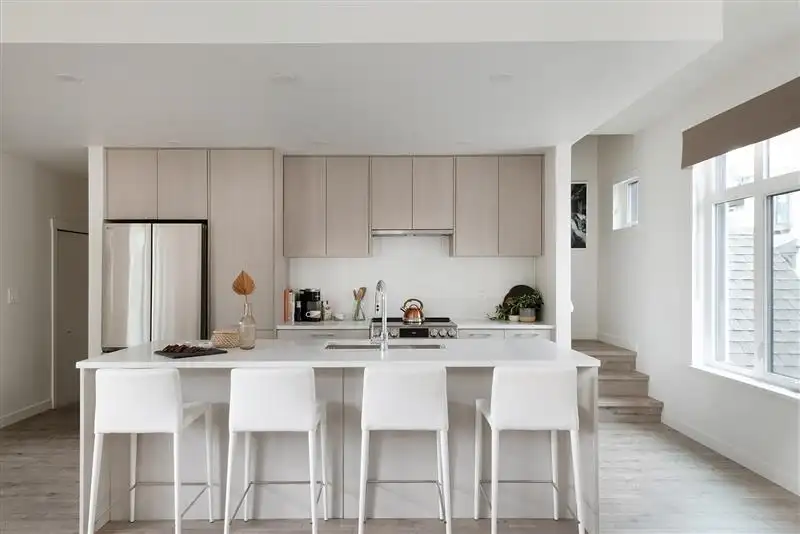
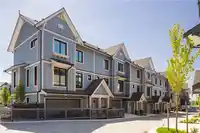
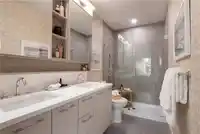
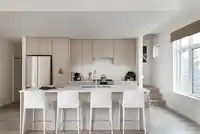
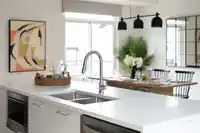
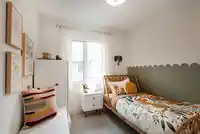
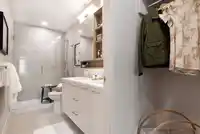
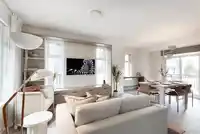
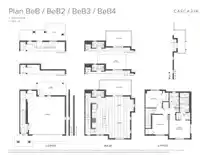
Welcome to Cascadia by StreetSide Developments in Willoughby, featuring the first net-zero ready townhomes south of the Fraser. This corner 3 bedroom, 2.5 bathroom home offers an open-concept main floor with a large balcony, quartz countertops with an oversized island and premium LG stainless steel appliances. A spacious double garage for two cars with…
Features
Property Details
School Catchment
Neighbourhood
Age
- Under 1519.4%
- 15 to 6471.6%
- 65 and over9.1%
Household size
- 1 person19.4%
- 228.8%
- 318%
- 419.6%
- 5 or more14.1%
Language spoken at home
55.7% English mother tongue
Mother tongue, share of 7,385 residents.
How this pocket differs
- more 5+ person households than Willoughby Heights 14.1% vs 11.6%
- notably more Punjabi speakers than Willoughby Heights 4.7% vs 3%
- more Mandarin speakers than Willoughby Heights 6.8% vs 4.8%
Source: Statistics Canada, Census of Population, 2021. Reproduced and distributed on an "as is" basis with the permission of Statistics Canada.
Recent nearby sales
Sold prices are available to registered users. Log in to see what these sold for.
Monthly Cost Calculator
An estimate only. Canadian semi-annual compounding; excludes utilities, closing costs and BC property transfer tax. 5-year fixed, as of Sep 24
Similar Listings Nearby
180 6951 204 STREET
206 6951 204 STREET
15 6983 204 STREET
13 6983 204 STREET
6 6983 204 STREET
134 6951 204 STREET
198 6951 204 STREET
165 6951 204 STREET
44 20335 70A AVENUE
39 20335 70A AVENUE
41 20335 70A AVENUE
18 6917 204 STREET