
 1 / 29 photos
















About This Property
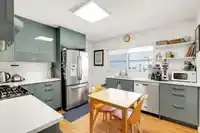
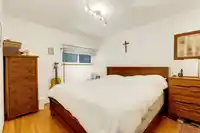
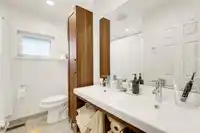
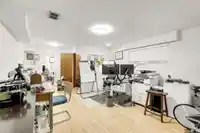
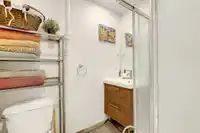
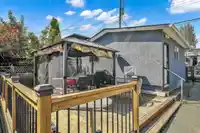
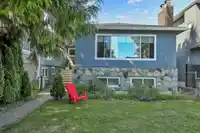
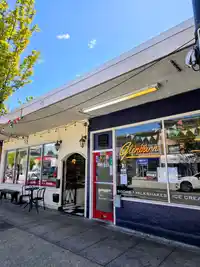
This lovingly maintained family home in the Heights offers an unmatched lifestyle where everything you need is steps from your front door. Original hardwood greets you with warmth and charm. Three spacious bedrooms on main floor (primary fits king) with lots of updates throughout. Fully finished basement w/ easy suite potential. The vibrant Hastings Street…
Property Details
School Catchment
Neighbourhood
Age
- Under 1514.4%
- 15 to 6465.9%
- 65 and over19.7%
Household size
- 1 person28.2%
- 229.1%
- 317.1%
- 415.5%
- 5 or more10.1%
Language spoken at home
46.8% English mother tongue
Mother tongue, share of 5,440 residents.
How this pocket differs
- more 5+ person households than Burnaby North 10.1% vs 7.1%
- notably more Italian speakers than Burnaby North 5.5% vs 2.5%
- notably fewer Mandarin speakers than Burnaby North 4.8% vs 8.7%
- notably more Cantonese speakers than Burnaby North 18.6% vs 11.7%
- Median dwelling value is higher than Metro Vancouver $1,500,000 vs $1,050,000
Source: Statistics Canada, Census of Population, 2021. Reproduced and distributed on an "as is" basis with the permission of Statistics Canada.
Land & Development
Zoning, lot dimensions and grade are approximate, from public data, and for reference only — verify with the City / Township of Langley before relying on them.
Recent nearby sales
Sold prices are available to registered users. Log in to see what these sold for.
Monthly Cost Calculator
An estimate only. Canadian semi-annual compounding; excludes utilities, closing costs and BC property transfer tax. 5-year fixed, as of Oct 15
Similar Listings Nearby
4205 PENDER STREET
2 4210 UNION STREET
4009 UNION STREET
3906 PENDER STREET
4116 CAMBRIDGE STREET
4264 PARKER STREET
3964 DUNDAS STREET
3945 PARKER STREET
4154 MCGILL STREET
120 ROSSER AVENUE
4137 MCGILL STREET
4298 MCGILL STREET