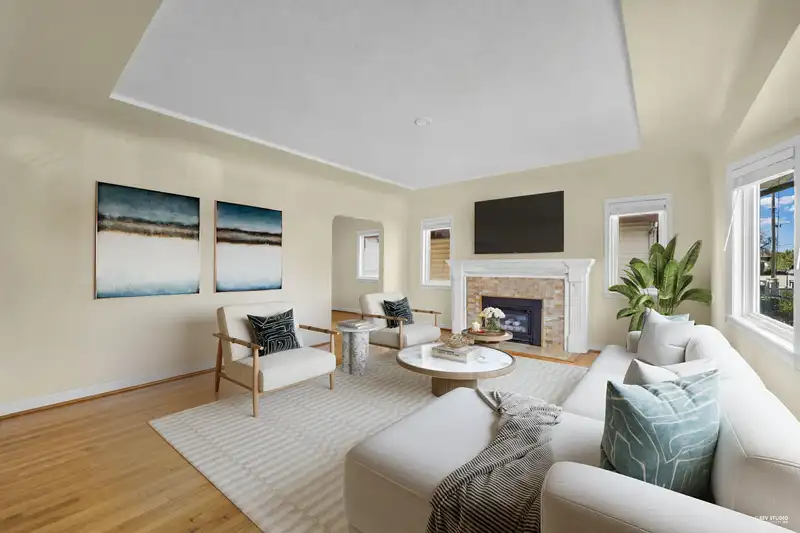
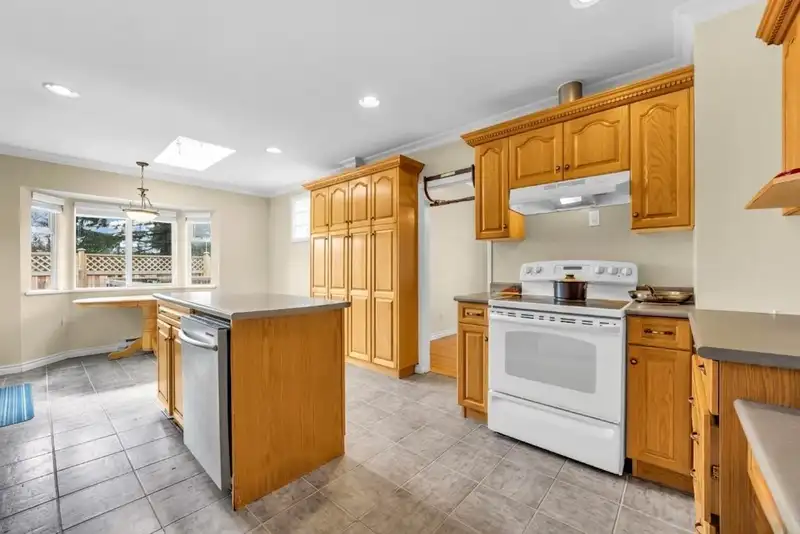
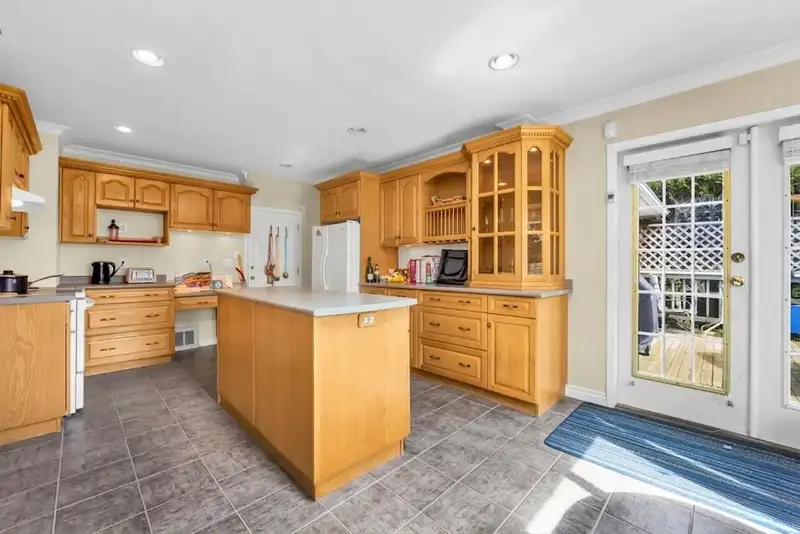
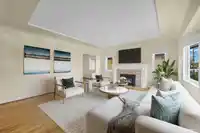
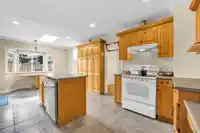
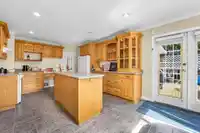
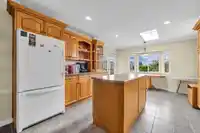
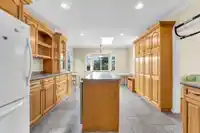
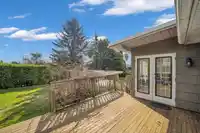
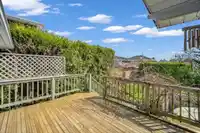
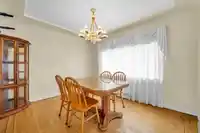
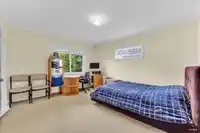
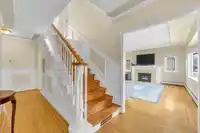
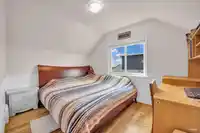
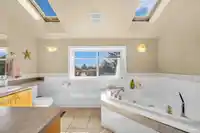
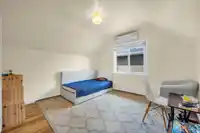
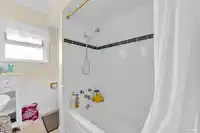
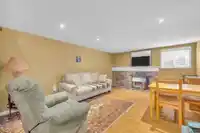
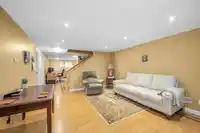
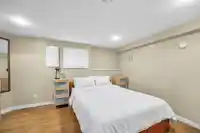
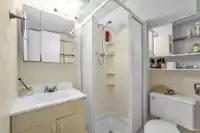
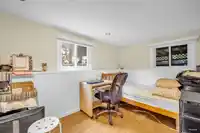
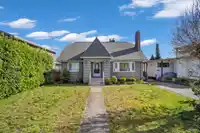
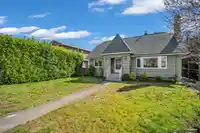
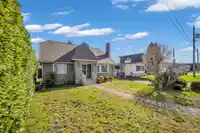
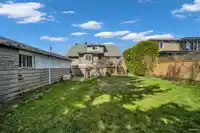
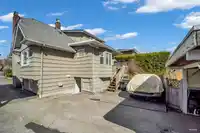
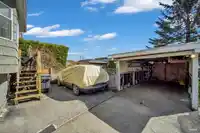
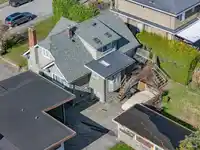
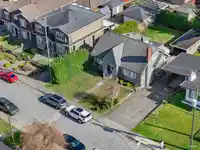
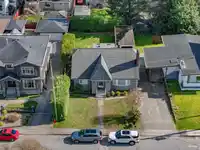
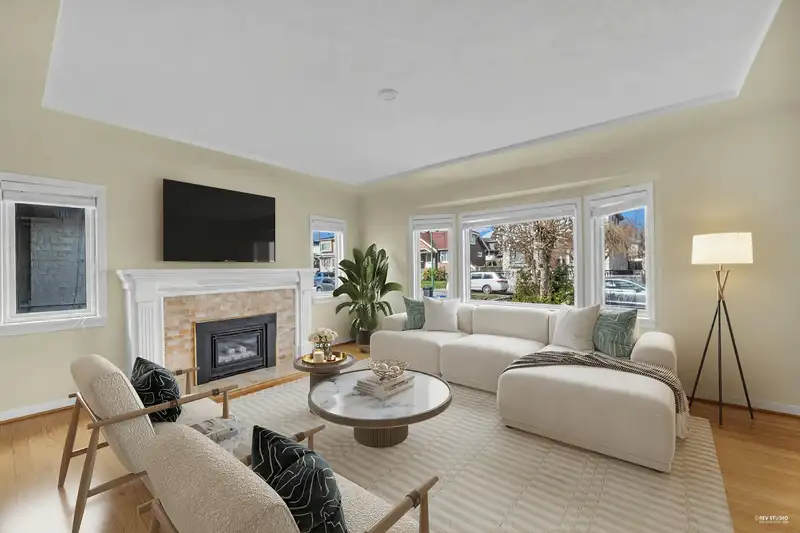
EXCEPTIONAL OPPORTUNITY IN EAST BURNABY! Discover this solid 2,949 sq. ft. family home situated on a prime 50' x 120' (6,000 sq. ft.) flat lot. This well-maintained residence features 5 spacious bedrooms and 3 bathrooms, a nice kitchen, Air Conditioning, a lower floor with separate entry that can be turned to a suite and a functional layout perfect for…
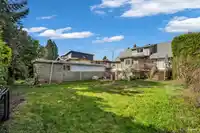
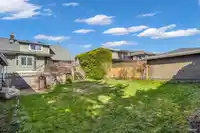
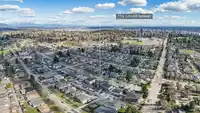
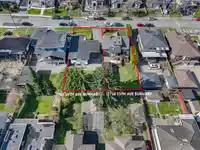
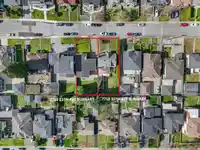
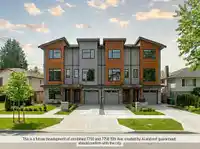
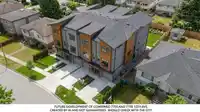
EXCEPTIONAL OPPORTUNITY IN EAST BURNABY! Discover this solid 2,949 sq. ft. family home situated on a prime 50' x 120' (6,000 sq. ft.) flat lot. This well-maintained residence features 5 spacious bedrooms and 3 bathrooms, a nice kitchen, Air Conditioning, a lower floor with separate entry that can be turned to a suite and a functional layout perfect for families or as a high-yield holding property. Located in a vibrant, walkable neighbourhood, you are just minutes from the Edmonds community Center, top-rated schools, and beautiful parks. Potential rezoning for Small-Scale Multi-Unit Housing (SSMUH) if combined with 7750 15th Ave. Can build up to 12 UNITS total (6 per lot). Buyers are advised to verify all rezoning with the City. Give us a call for more information.
Features
Private Yard
Carport Single
Front Access
Shopping Nearby
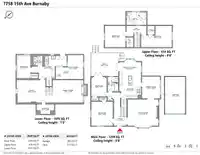
Room measurements12 rooms▸
Living RoomMain · 15'11 × 17'4
Dining RoomMain · 12'5 × 10'3
KitchenMain · 13'1 × 12'4
BedroomMain · 11'1 × 8'9
BedroomMain · 13'8 × 12'2
BedroomAbove · 12'2 × 11'8
Primary BedroomAbove · 12'2 × 17'6
Living RoomBelow · 12'9 × 17'3
OfficeBelow · 12'9 × 15'10
BedroomBelow · 12'7 × 7'5
LaundryBelow · 12'9 × 19'11
WorkshopBelow · 13'8 × 15'7
Floor plan
🔍 Tap to zoom
Pinch or scroll to zoom · drag to pan · double-tap to reset
Property Details
MLS NumberR3136405
Property TypeSingle Family Residence
Bedrooms5
Bathrooms3
Square Feet2,949
Lot Size6,000 sqft
Year Built1948
Parking Spaces1
HeatingForced Air
StatusPending
Listed ByRoyal Pacific Lions Gate Realty Ltd.
School Catchment
ElementarySecond Street
SecondaryCariboo Hill
Neighbourhood
Highlighted area = this home's census tract (StatCan), the boundary the neighbourhood stats describe.
$1,500,000Median home value
$98,000Median household income
61.2%Owner-occupied
30.4%Single-detached homes
3.1Avg household size
42.8Median age
36.5%Bachelor's degree or higher (25-64)
53.8%Commute under 30 min
76.4%Drive to work
55.1%Foreign-born residents
7,998Neighbourhood population
Age
Under 1513.7%
15 to 6464.5%
65 and over21.8%
Household size
1 person17.6%
225.9%
319.9%
418.4%
5 or more18.2%
Language spoken at home
32.8% English mother tongue
Punjabi11.4%
Mandarin10.2%
Cantonese9.5%
English + other6.5%
Tagalog5.6%
Hindi2.9%
All others21.1%
Mother tongue, share of 7,435 residents.
How this pocket differs
more seniors 65+ than Burnaby East 21.8% vs 16.2%
more 5+ person households than Burnaby East 18.3% vs 13%
notably more Punjabi speakers than Burnaby East 11.4% vs 5.1%
Median dwelling value is higher than Metro Vancouver $1,500,000 vs $1,050,000
Source: Statistics Canada, Census of Population, 2021. Reproduced and distributed on an "as is" basis with the permission of Statistics Canada.
Land & Development
Lot size5,965 sqft
Lot dimensions50 × 120 ft
Lot shapeRectangular
Approximate lot lines (ParcelMap BC)
Zoning, lot dimensions and grade are approximate, from public data, and for reference only — verify with the City / Township of Langley before relying on them.
Recent nearby sales
Sold prices are available to registered users. Log in to see what these sold for.

 1 / 37 photos