
 1 / 34 photos




About This Property
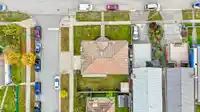
CORNER LOT | MOUNTAIN & CITY VIEW | WALK TO METROTOWN | Welcome to a rarely available 4-bedroom home in the heart of Burnaby South. Set on a quiet INNER street, this corner lot with wide frontage enjoys abundant natural light from both south and north exposures. Perched on the higher side, the home captures beautiful mountain and city views. A suite with…
Features
Property Details
School Catchment
Neighbourhood
Age
- Under 1510.8%
- 15 to 6468.8%
- 65 and over20.5%
Household size
- 1 person21.2%
- 232.4%
- 317.3%
- 417.6%
- 5 or more11.5%
Language spoken at home
33.4% English mother tongue
Mother tongue, share of 3,785 residents.
How this pocket differs
- notably more 5+ person households than Burnaby South 11.6% vs 7.7%
- more 4-person households than Burnaby South 17.7% vs 12.3%
- fewer people living alone than Burnaby South 21.3% vs 30.4%
- more Punjabi speakers than Burnaby South 3% vs 2.3%
- more Mandarin speakers than Burnaby South 21.4% vs 17.4%
- Median dwelling value is notably higher than Metro Vancouver $1,800,000 vs $1,050,000
Source: Statistics Canada, Census of Population, 2021. Reproduced and distributed on an "as is" basis with the permission of Statistics Canada.
Land & Development
Within a provincially designated Transit-Oriented Area, this lot may support up to 3 FAR / 8 storeys regardless of base zoning. Provincial minimums and approximate — municipal rezoning, servicing and parking standards still apply.
Zoning, lot dimensions and grade are approximate, from public data, and for reference only — verify with the City / Township of Langley before relying on them.
Recent nearby sales
Sold prices are available to registered users. Log in to see what these sold for.
Monthly Cost Calculator
An estimate only. Canadian semi-annual compounding; excludes utilities, closing costs and BC property transfer tax. 5-year fixed, as of Oct 28
Similar Listings Nearby
4843 MAITLAND STREET
4791 SARDIS STREET
4757 BUXTON STREET
5548 NELSON AVENUE
4625 GRAFTON STREET
4854 BOND STREET
4694 NORTHVIEW COURT
4736 CURR PLACE
5578 OAKGLEN DRIVE
2 5337 ELSOM AVENUE
5433 ELSOM AVENUE
4646 CHARLOTTE COURT