
 1 / 32 photos
About This Property
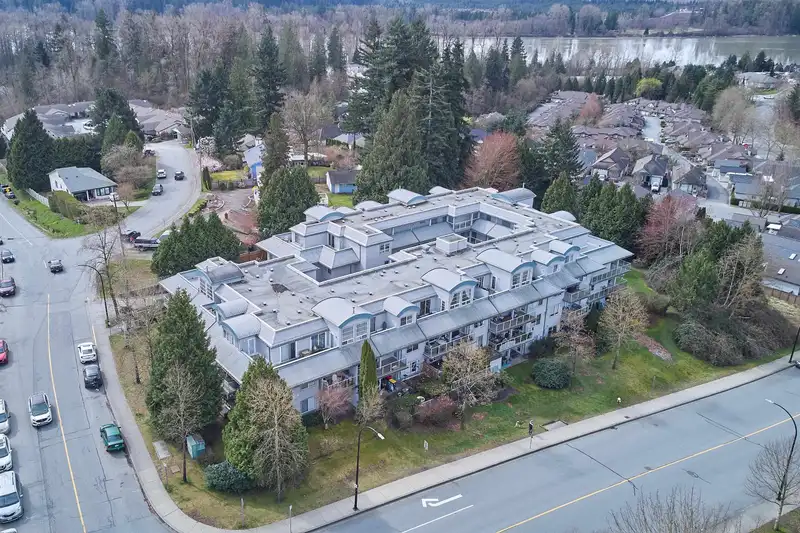
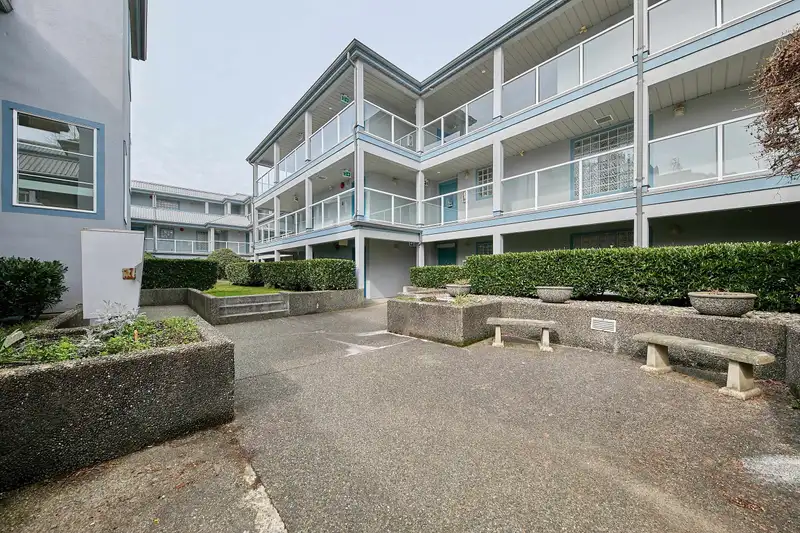
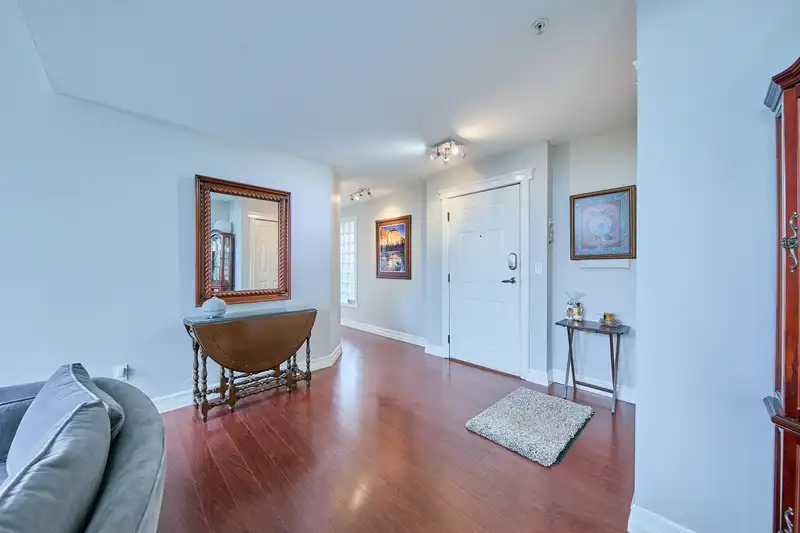
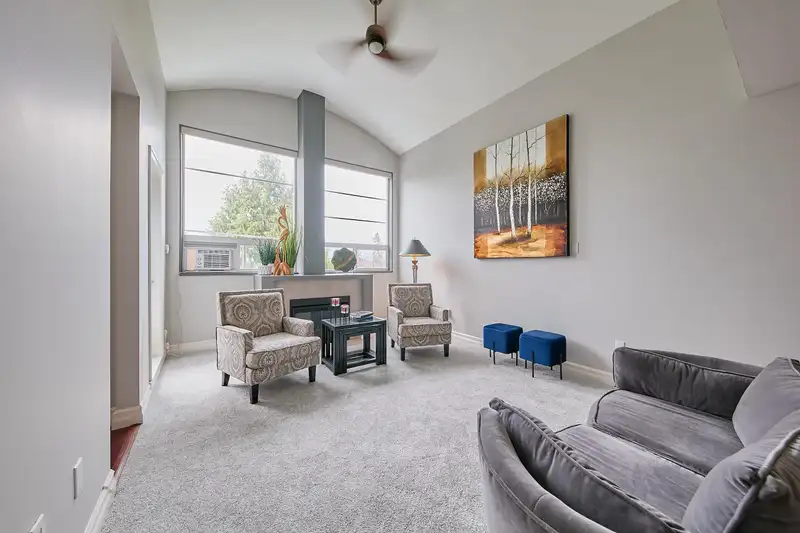
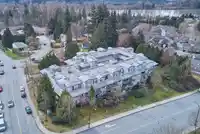
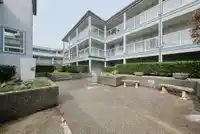
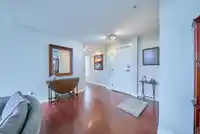
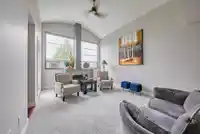
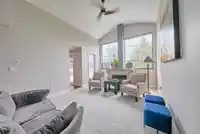
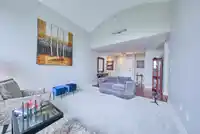
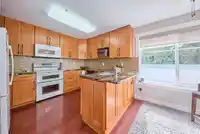
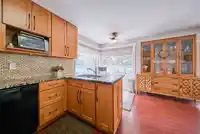
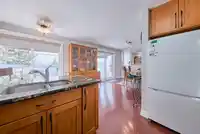
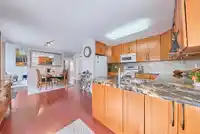
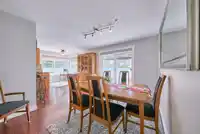
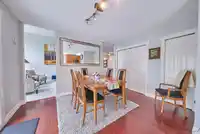
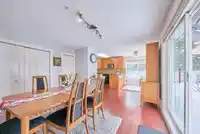
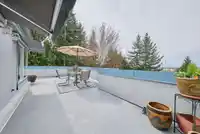
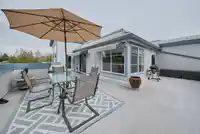
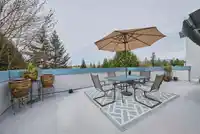
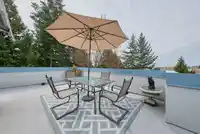
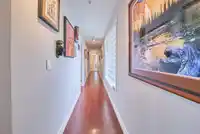
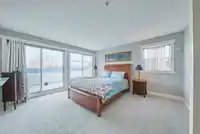
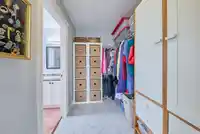
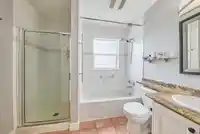
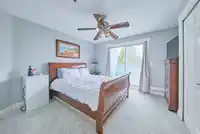
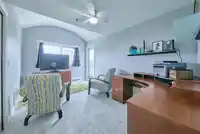
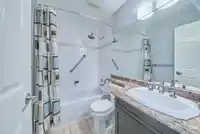
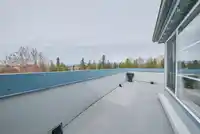
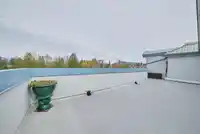
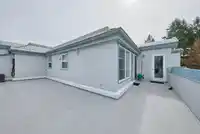
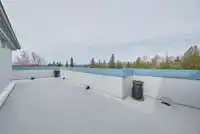
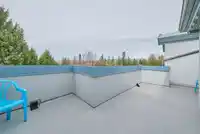
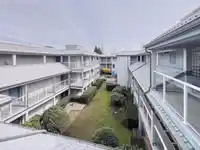
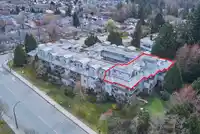
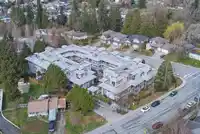
STUNNING VIEWS FROM THE PENTHOUSE!! Spacious one level living with 3 bedrooms and approximately 1000 extra square feet in 3 outdoor deck areas. This bright home has vaulted ceilings, newer kitchen and fresh paint & carpets. Privately located on the entire west side of the building with views of the Fraser River, Golden Ears and Mount Baker. Every room in…
Features
Property Details
School Catchment
Neighbourhood
Age
- Under 159%
- 15 to 6460.2%
- 65 and over30.8%
Household size
- 1 person50.4%
- 232.9%
- 38.8%
- 45.2%
- 5 or more2.7%
Language spoken at home
75.2% English mother tongue
Mother tongue, share of 5,425 residents.
How this pocket differs
- notably fewer children under 15 than East Central 9% vs 14.3%
- more seniors 65+ than East Central 30.8% vs 20.6%
- notably fewer 5+ person households than East Central 2.7% vs 7.5%
- notably fewer 4-person households than East Central 5.2% vs 12.3%
- notably more people living alone than East Central 50.5% vs 32.5%
- Median household income is notably lower than Metro Vancouver $57,600 vs $90,000
- Median dwelling value is notably lower than Metro Vancouver $412,000 vs $1,050,000
Source: Statistics Canada, Census of Population, 2021. Reproduced and distributed on an "as is" basis with the permission of Statistics Canada.
Recent nearby sales
Sold prices are available to registered users. Log in to see what these sold for.
Monthly Cost Calculator
An estimate only. Canadian semi-annual compounding; excludes utilities, closing costs and BC property transfer tax. 5-year fixed, as of Nov 2
Similar Listings Nearby
404 22858 LOUGHEED HIGHWAY
304 22858 LOUGHEED HIGHWAY
108 11639 227 STREET
503 11639 227 STREET
303 11601 227 STREET
510 11605 227TH STREET
308 11609 227 STREET
414 11887 BURNETT STREET
301 11887 BURNETT STREET
315 11641 227 STREET
413 11641 227 STREET
317 11641 227 STREET