
 1 / 32 photos







About This Property
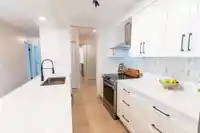
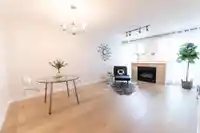
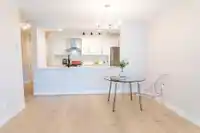
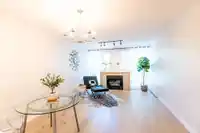
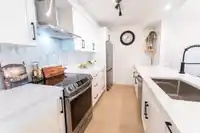
Bright and beautifully renovated 2 bed/2 bath penthouse in the heart of downtown Coquitlam! Practically new, since everything was renovated. Featuring expansive windows, abundant natural light, stunning mountain views, and a cozy gas fireplace. The updated kitchen offers stainless steel appliances and ample cabinet space. Freshly painted with brand new…
Property Details
School Catchment
Neighbourhood
Age
- Under 1511.5%
- 15 to 6472.4%
- 65 and over16.1%
Household size
- 1 person35.8%
- 238.2%
- 317.2%
- 47.3%
- 5 or more1.5%
Language spoken at home
29.9% English mother tongue
Mother tongue, share of 6,780 residents.
How this pocket differs
- fewer children under 15 than Coquitlam 11.5% vs 15.1%
- notably fewer 5+ person households than Coquitlam 1.5% vs 9.3%
- notably fewer 4-person households than Coquitlam 7.3% vs 17.2%
- notably more people living alone than Coquitlam 35.8% vs 22.9%
- notably more Farsi speakers than Coquitlam 15.4% vs 5.1%
- notably more Korean speakers than Coquitlam 12.6% vs 6.8%
- Median household income is lower than Metro Vancouver $63,600 vs $90,000
- Median dwelling value is notably lower than Metro Vancouver $560,000 vs $1,050,000
Source: Statistics Canada, Census of Population, 2021. Reproduced and distributed on an "as is" basis with the permission of Statistics Canada.
Recent nearby sales
Sold prices are available to registered users. Log in to see what these sold for.
Monthly Cost Calculator
An estimate only. Canadian semi-annual compounding; excludes utilities, closing costs and BC property transfer tax. 5-year fixed, as of Oct 30
Similar Listings Nearby
210 1163 THE HIGH STREET
502 2979 GLEN DRIVE
2607 2978 GLEN DRIVE
1104 2978 GLEN DRIVE
702 1155 THE HIGH STREET
2802 1155 THE HIGH STREET
2207 1155 THE HIGH STREET
2801 1155 THE HIGH STREET
3003 2980 ATLANTIC AVENUE
608 2979 GLEN DRIVE
1105 1185 THE HIGH STREET
1703 1185 THE HIGH STREET