
 1 / 37 photos




















About This Property
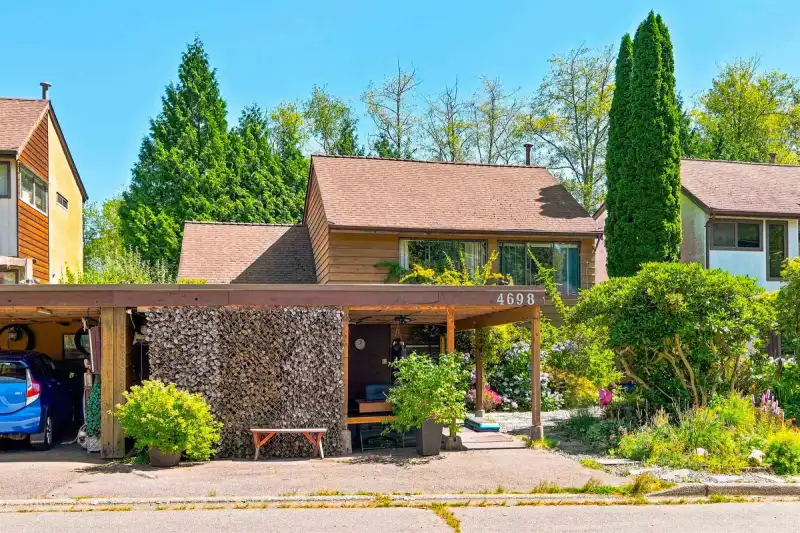
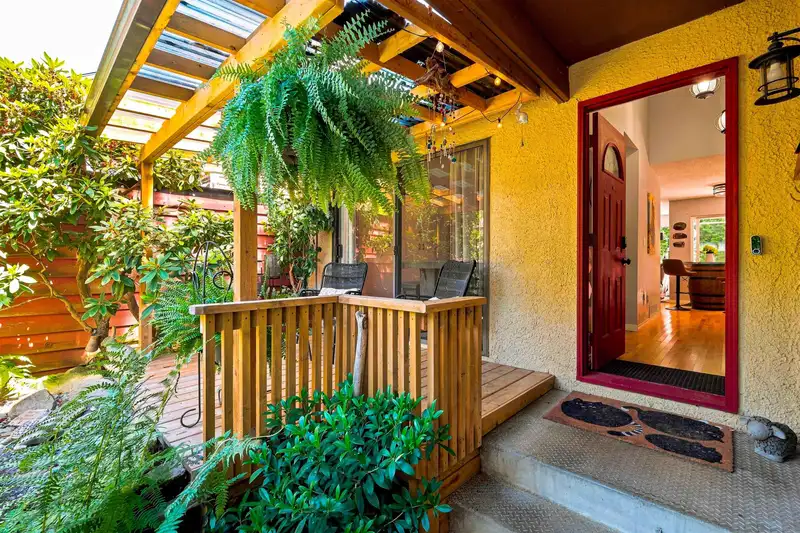
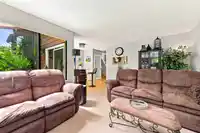
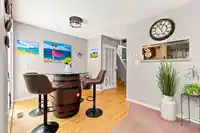
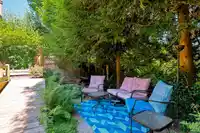
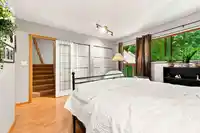
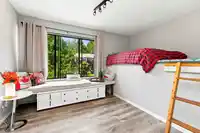
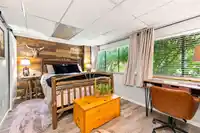
Renovated 4 bedroom home in family-oriented Greentree Village! Open 13' ceiling in foyer. 2021 kitchen reno features new counters, floors, sink & newer appliances. Eating area has built-in cabinets and opens up to the trellised front patio redone in 2020. Spacious living room is open to the dining room and leads out to 2nd wraparound deck also done in 2020…
Features
Property Details
School Catchment
Neighbourhood
Age
- Under 1514%
- 15 to 6465%
- 65 and over21%
Household size
- 1 person18.8%
- 232.6%
- 318.8%
- 419%
- 5 or more10.9%
Language spoken at home
52.3% English mother tongue
Mother tongue, share of 5,335 residents.
How this pocket differs
- notably fewer people living alone than Burnaby South 18.8% vs 30.4%
- notably more 4-person households than Burnaby South 19% vs 12.3%
- more 5+ person households than Burnaby South 10.9% vs 7.7%
- notably fewer Cantonese speakers than Burnaby South 6.6% vs 11.4%
- notably fewer Mandarin speakers than Burnaby South 11.4% vs 17.4%
- Median household income is higher than Metro Vancouver $115,000 vs $90,000
Source: Statistics Canada, Census of Population, 2021. Reproduced and distributed on an "as is" basis with the permission of Statistics Canada.
Land & Development
Zoning, lot dimensions and grade are approximate, from public data, and for reference only — verify with the City / Township of Langley before relying on them.
Recent nearby sales
Sold prices are available to registered users. Log in to see what these sold for.
Monthly Cost Calculator
An estimate only. Canadian semi-annual compounding; excludes utilities, closing costs and BC property transfer tax. 5-year fixed, as of Oct 22
Similar Listings Nearby
4638 ROYAL OAK AVENUE
4645 CHARLOTTE COURT
4646 CHARLOTTE COURT
4854 BOND STREET
4757 BUXTON STREET
4910 WILLINGDON AVENUE
5548 NELSON AVENUE
5578 OAKGLEN DRIVE
4465 PRICE CRESCENT
4383 PINEWOOD CRESCENT
4729 CANADA WAY
4843 MAITLAND STREET