
 1 / 28 photos


About This Property
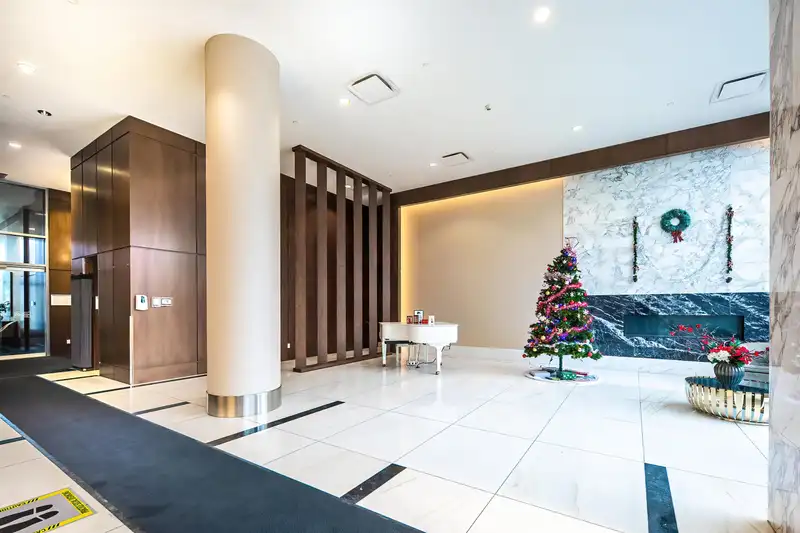
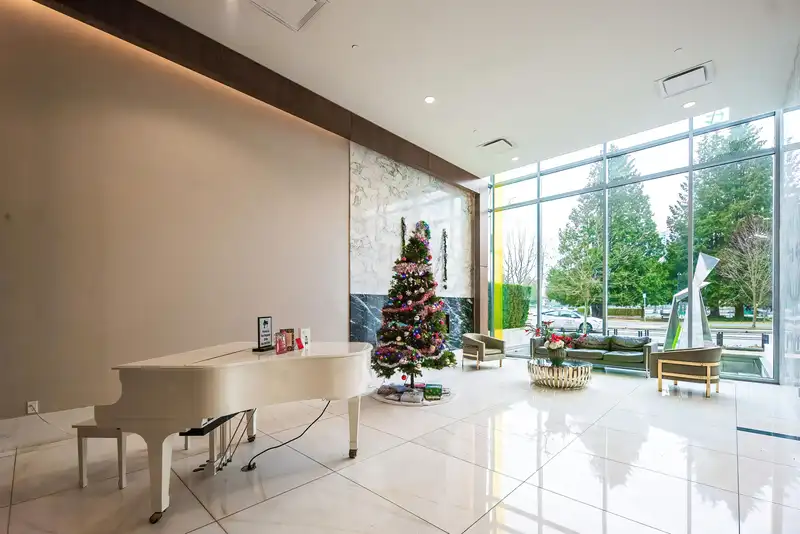
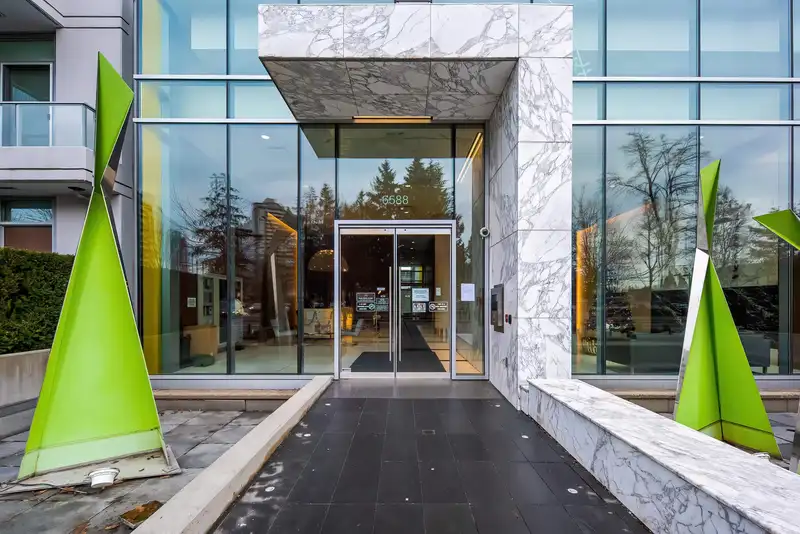
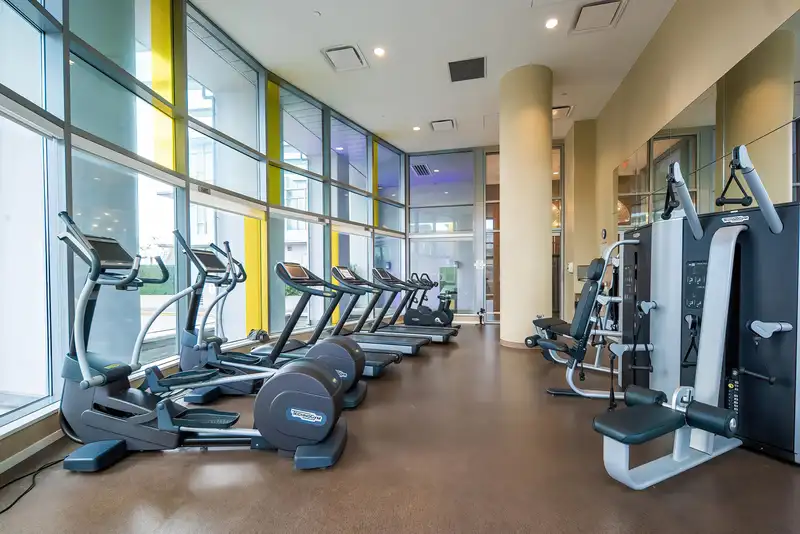
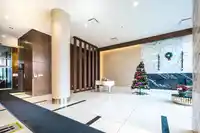
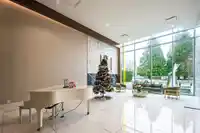
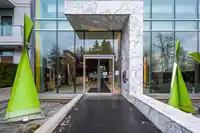
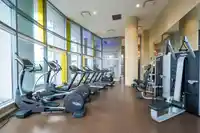
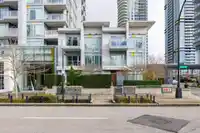
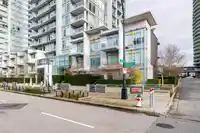
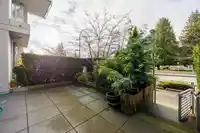
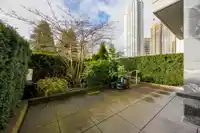
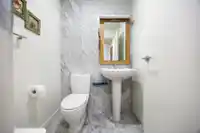
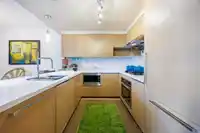
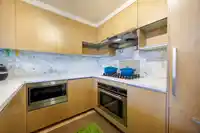
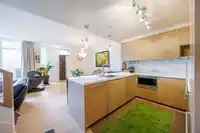
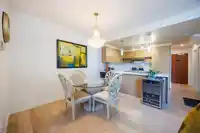
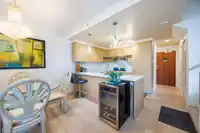
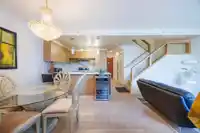
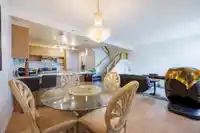
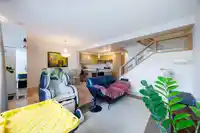
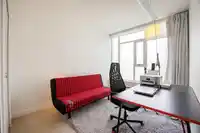
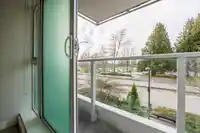
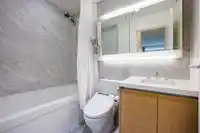
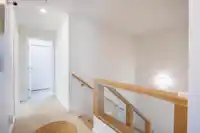
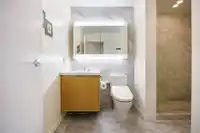
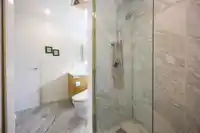
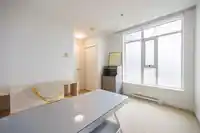
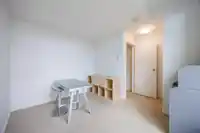
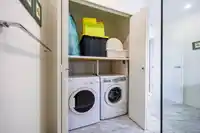
Luxury two-level concrete townhouse at The Met by Concord Pacific, located in the heart of Metrotown, one of Burnaby’s most vibrant urban centres. This well-designed home offers 3 bedrooms, 3 bathrooms plus a den. The main level features an open-concept kitchen, dining & living area w/ powder room, ideal for modern living and entertaining, plus access to a…
Features
Property Details
School Catchment
Neighbourhood
Age
- Under 1510.1%
- 15 to 6472.6%
- 65 and over17.3%
Household size
- 1 person39.4%
- 238.2%
- 313.8%
- 46.8%
- 5 or more1.7%
Language spoken at home
29.9% Mandarin mother tongue
Mother tongue, share of 9,705 residents.
How this pocket differs
- notably fewer 5+ person households than Metrotown 1.7% vs 4.6%
- fewer 4-person households than Metrotown 6.8% vs 9.2%
- more Mandarin speakers than Metrotown 29.9% vs 21.9%
- more Korean speakers than Metrotown 4.7% vs 3.5%
- more Cantonese speakers than Metrotown 14% vs 11.3%
- Median household income is notably lower than Metro Vancouver $58,400 vs $90,000
- Median dwelling value is notably lower than Metro Vancouver $700,000 vs $1,050,000
Source: Statistics Canada, Census of Population, 2021. Reproduced and distributed on an "as is" basis with the permission of Statistics Canada.
Recent nearby sales
Sold prices are available to registered users. Log in to see what these sold for.
Monthly Cost Calculator
An estimate only. Canadian semi-annual compounding; excludes utilities, closing costs and BC property transfer tax. 5-year fixed, as of Nov 3
Similar Listings Nearby
6515 NELSON AVENUE
6693 MARLBOROUGH AVENUE
4818 HAZEL STREET
35 6868 BURLINGTON AVENUE
4715 4711 HAZEL STREET
204 7227 ROYAL OAK AVENUE
6471 TELFORD AVENUE
59 6528 DENBIGH AVENUE
25 5298 OAKMOUNT CRESCENT
48 5298 OAKMOUNT CRESCENT
2 5298 OAKMOUNT CRESCENT
1 5091 BUXTON STREET