
 1 / 1 photos
About This Property
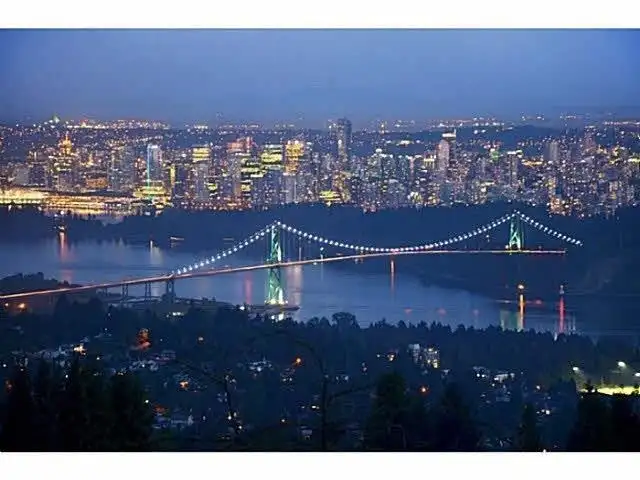
VIEW VIEW VIEW! PRICELESS OPPORTUNITY! NO DOUBT, BEST LOT IN THE AREA. Unmatched panoramic views - ocean, downtown Vancouver, Lions Gate Bridge, and mountains all in one frame. Located on one of the best and rarest lots in the prestigious British Properties, this 100 x 120 ft perfectly flat property offers a gently sloped driveway and a completely level…
Property Details
School Catchment
Neighbourhood
Age
- Under 1514.9%
- 15 to 6463.1%
- 65 and over22%
Household size
- 1 person19.8%
- 231.7%
- 319.4%
- 418.2%
- 5 or more10.8%
Language spoken at home
40.5% English mother tongue
Mother tongue, share of 7,970 residents.
How this pocket differs
- fewer seniors 65+ than West Vancouver 22% vs 28.1%
- fewer people living alone than West Vancouver 19.8% vs 28.8%
- more 5+ person households than West Vancouver 10.9% vs 7.8%
- more 4-person households than West Vancouver 18.3% vs 14.8%
- notably more Mandarin speakers than West Vancouver 24.3% vs 12.3%
- more Cantonese speakers than West Vancouver 3.1% vs 2.1%
- Median dwelling value is notably higher than Metro Vancouver $3,560,000 vs $1,050,000
Source: Statistics Canada, Census of Population, 2021. Reproduced and distributed on an "as is" basis with the permission of Statistics Canada.
Land & Development
Zoning, lot dimensions and grade are approximate, from public data, and for reference only — verify with the City / Township of Langley before relying on them.
Recent nearby sales
Sold prices are available to registered users. Log in to see what these sold for.
Monthly Cost Calculator
An estimate only. Canadian semi-annual compounding; excludes utilities, closing costs and BC property transfer tax. 5-year fixed, as of Oct 30
Similar Listings Nearby
1359 WHITBY ROAD
1485 CAMELOT ROAD
1437 BRAMWELL ROAD
1378 CHARTWELL DRIVE
1409 CHARTWELL DRIVE
1285 CHARTWELL CRESCENT
1355 TYROL ROAD
1364 CHARTWELL DRIVE
1407 BRAMWELL ROAD
1595 TYROL COURT
1590 TYROL COURT
1497 QUEENS AVENUE