
 1 / 24 photos











About This Property
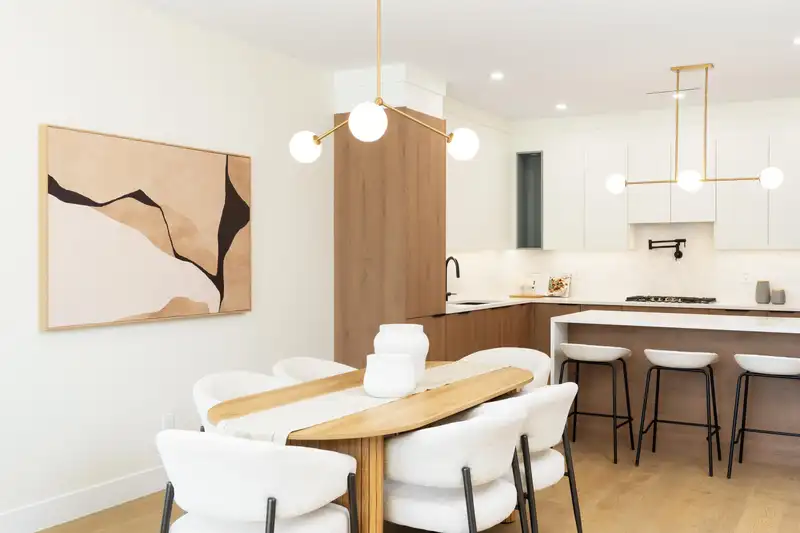
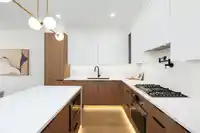
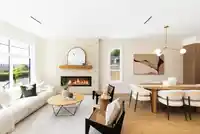
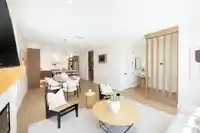
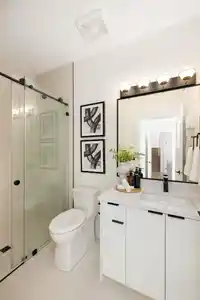
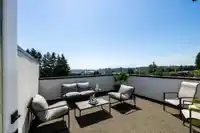
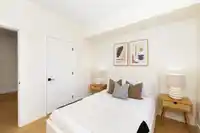
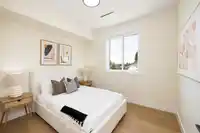
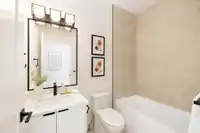
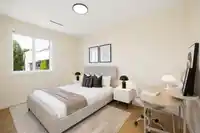
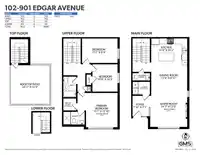
Come home to this limited collection of beautifully crafted DUPLEX RESIDENCES showcasing PANORAMIC Fraser River views + PRIVATE ROOFTOP. This stunning 1652 SF 3 bed/3 bath home offers a bright open-concept floorplan w/oversized windows, refined finishes & exceptional natural light throughout. The chef-inspired kitchen features quartz countertops, premium…
Property Details
School Catchment
Neighbourhood
Age
- Under 1513.7%
- 15 to 6469.9%
- 65 and over16.4%
Household size
- 1 person25.8%
- 230.6%
- 318.1%
- 415.3%
- 5 or more10.2%
Language spoken at home
44.9% English mother tongue
Mother tongue, share of 4,610 residents.
How this pocket differs
- notably more Punjabi speakers than Coquitlam 3% vs 0.8%
- notably more Tagalog speakers than Coquitlam 3.7% vs 1.7%
- fewer Mandarin speakers than Coquitlam 7.2% vs 9.7%
- more Korean speakers than Coquitlam 9.2% vs 6.8%
Source: Statistics Canada, Census of Population, 2021. Reproduced and distributed on an "as is" basis with the permission of Statistics Canada.
Land & Development
Zoning, lot dimensions and grade are approximate, from public data, and for reference only — verify with the City / Township of Langley before relying on them.
Recent nearby sales
Sold prices are available to registered users. Log in to see what these sold for.
Monthly Cost Calculator
An estimate only. Canadian semi-annual compounding; excludes utilities, closing costs and BC property transfer tax. 5-year fixed, as of Oct 20
Similar Listings Nearby
101 929 STEWART AVENUE
101 910 DELESTRE AVENUE
102 914 ROCHESTER AVENUE
103 269 KING STREET
907 HARRIS AVENUE
970 ROCHESTER AVENUE
104 1026 STEWART AVENUE
102 1026 STEWART AVENUE
101 314 NELSON STREET
102 314 NELSON STREET
104 314 NELSON STREET
718 DELESTRE AVENUE