
 1 / 40 photos















About This Property
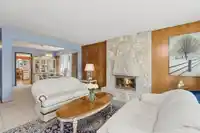
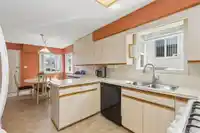
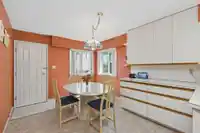
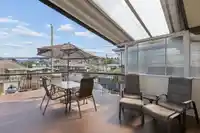
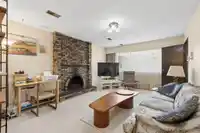
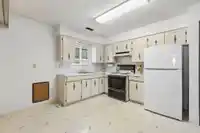
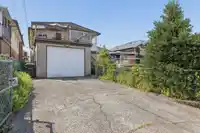
Welcome to this CLASSIC 70's SPECIAL, a Solid Custom Built 5 Bedroom VIEW Home on CAPITOL HILL, with GREAT MOUNTAIN VIEWS, including the LIONS, from the large oversized Back Deck, partly covered. Home has been very well maintained, Metal Roof, Newer Windows a Gas Fireplace upstairs with 3 Bedrooms & 2 baths, Downstairs has a Family room and a 4th bedroom,…
Features
Property Details
School Catchment
Neighbourhood
Age
- Under 1512.4%
- 15 to 6466.8%
- 65 and over20.8%
Household size
- 1 person20.5%
- 230.6%
- 319%
- 418.1%
- 5 or more11.8%
Language spoken at home
46.2% English mother tongue
Mother tongue, share of 5,785 residents.
How this pocket differs
- more seniors 65+ than Brentwood Park 20.8% vs 14.4%
- notably more 5+ person households than Brentwood Park 11.8% vs 4.3%
- notably more 4-person households than Brentwood Park 18.1% vs 9.1%
- notably fewer people living alone than Brentwood Park 20.5% vs 33.8%
- notably more Italian speakers than Brentwood Park 5.5% vs 2.5%
- more Cantonese speakers than Brentwood Park 18.6% vs 14.2%
- Median dwelling value is notably higher than Metro Vancouver $1,600,000 vs $1,050,000
Source: Statistics Canada, Census of Population, 2021. Reproduced and distributed on an "as is" basis with the permission of Statistics Canada.
Land & Development
Zoning, lot dimensions and grade are approximate, from public data, and for reference only — verify with the City / Township of Langley before relying on them.
Monthly Cost Calculator
An estimate only. Canadian semi-annual compounding; excludes utilities, closing costs and BC property transfer tax. 5-year fixed, as of Oct 21
Similar Listings Nearby
750 BETA AVENUE
4809 GEORGIA STREET
4720 PANDORA STREET
4840 PARKER STREET
380 DELTA AVENUE
4560 PENDER STREET
175 DELTA AVENUE
4557 VENABLES STREET
4581 PARKER STREET
4708 WESTLAWN DRIVE
4993 VENABLES STREET
4503 FRANCES STREET