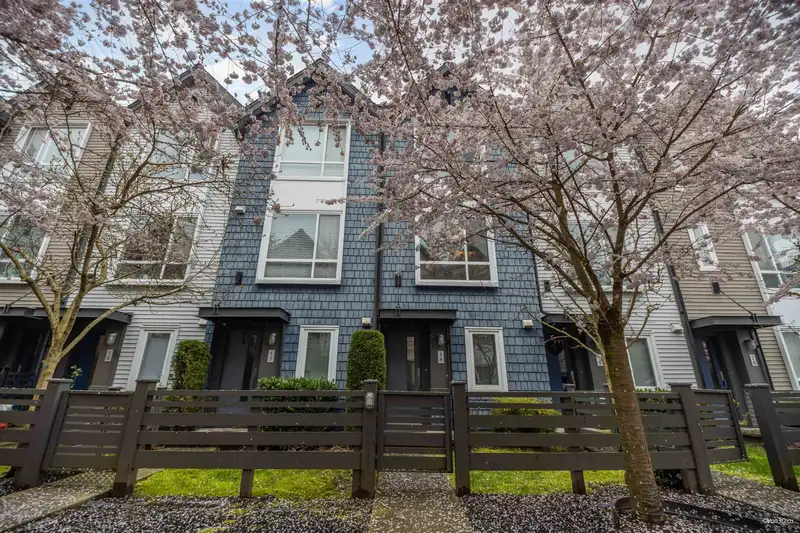
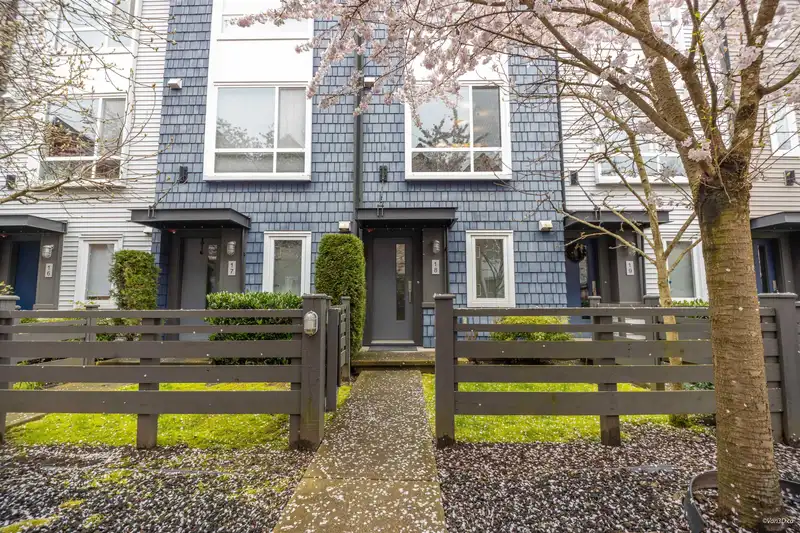
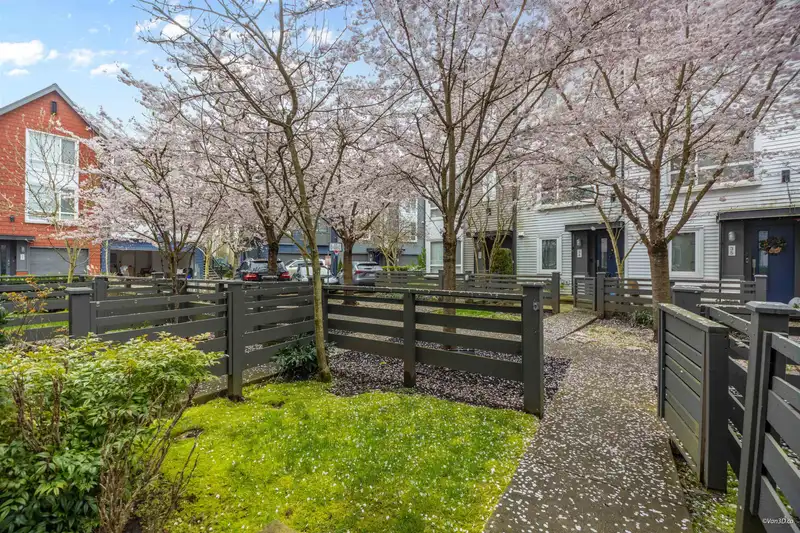
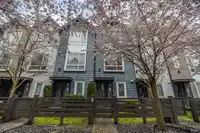
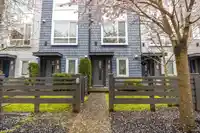
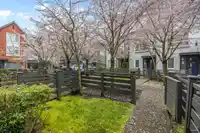
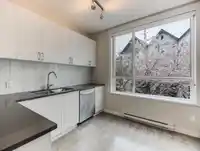
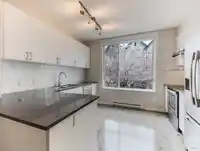
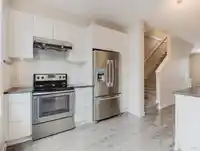
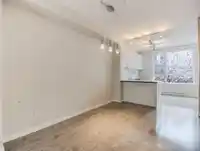
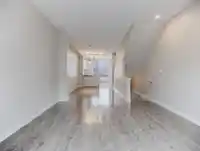
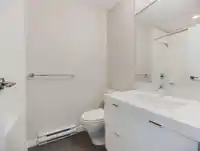
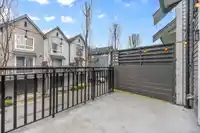
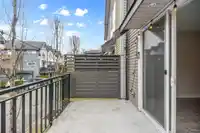
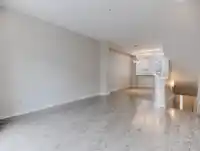
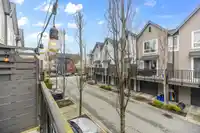
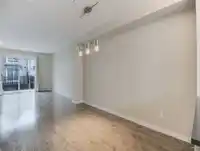
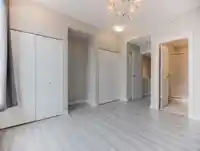
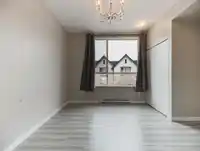
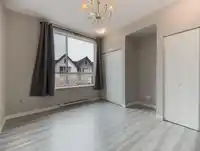
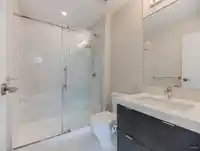
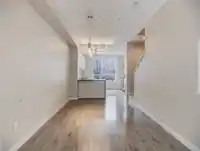
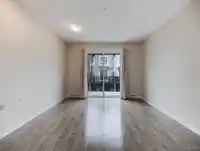
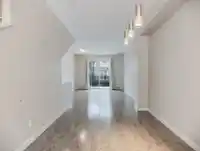
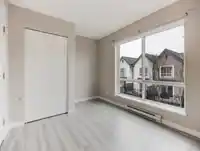
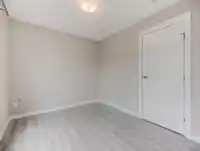
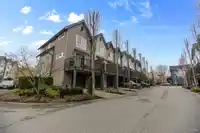
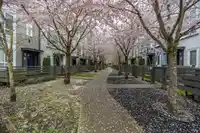
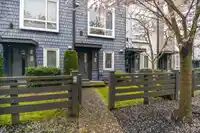
See Interactive Virtual. This 2-beds+den townhouse in Fremont Blue w/an open concept main level, lots of natural light & a spacious patio situated in a quiet, family neighbourhood. This home is 100% CARPET-FREE with high-quality flooring throughout, including stairs—perfect for allergy-free living. PREMIUM UPGRADES: Renovated kitchen w/newer cabinets,…
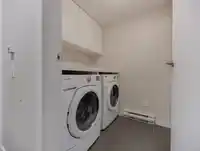
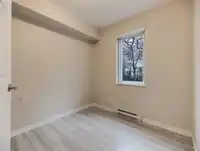
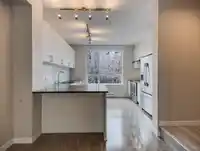
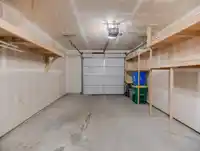
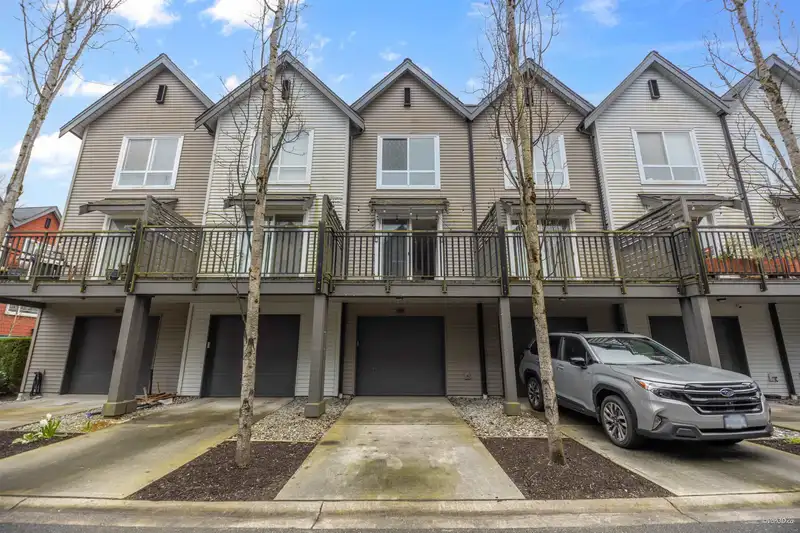
See Interactive Virtual. This 2-beds+den townhouse in Fremont Blue w/an open concept main level, lots of natural light & a spacious patio situated in a quiet, family neighbourhood. This home is 100% CARPET-FREE with high-quality flooring throughout, including stairs—perfect for allergy-free living. PREMIUM UPGRADES: Renovated kitchen w/newer cabinets, powerful range hood & brand-new dishwasher. The master features a spa-like shower & crystal chandelier. Custom-built closets in both bdrms & updated lighting, curtain throughout. UNIQUE FEATURES: Bright N/S exposure fills the home with light. Oversized private driveway fits a FULL-SIZED PICKUP TRUCK plus 1 garage spot. Large laundry room offers potential to add a powder room(strata apprvl). Stepout to blooming cherry blossoms! MOVE-IN READY!
Features
Garden
Private Yard
Additional Parking
Front Access
Concrete
Garage Door Opener
Shopping Nearby
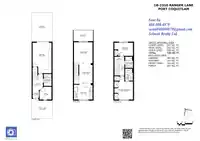
Room measurements10 rooms▸
PatioMain · 7'1 × 12'11
Living RoomAbove · 12'3 × 13'9
Dining RoomAbove · 8'9 × 13'2
KitchenAbove · 10'9 × 12'3
Primary BedroomAbv Main 2 · 10' × 12'
BedroomAbv Main 2 · 12'3 × 15'4
DenBelow · 7'9 × 8'6
LaundryBelow · 5'1 × 7'1
FoyerBelow · 4'11 × 4'1
OtherBelow · 13'9 × 19'4
Floor plan
🔍 Tap to zoom
Pinch or scroll to zoom · drag to pan · double-tap to reset
Property Details
MLS NumberR3109331
Property TypeTownhouse
Bedrooms2
Bathrooms2
Square Feet1,307
Year Built2014
Parking Spaces2
HeatingElectric
Strata Fee$334.43/mo
StatusClosed
Listed BySelmak Realty Limited
School Catchment
ElementaryBlakeburn Elementary
MiddleMinnekhada Middle
SecondaryTerry Fox Secondary
Neighbourhood
Highlighted area = this home's census tract (StatCan), the boundary the neighbourhood stats describe.
$900,000Median home value
$112,000Median household income
80.9%Owner-occupied
35.5%Single-detached homes
2.7Avg household size
40Median age
38.7%Bachelor's degree or higher (25-64)
53.9%Commute under 30 min
85.5%Drive to work
34.3%Foreign-born residents
5,732Neighbourhood population
Age
Under 1517.8%
15 to 6468.8%
65 and over13.4%
Household size
1 person19%
232.8%
321.8%
418.3%
5 or more8.2%
Language spoken at home
62.8% English mother tongue
Cantonese5.2%
Korean3.7%
Mandarin3.6%
English + other3.4%
Punjabi3%
Tagalog1.9%
All others16.4%
Mother tongue, share of 5,730 residents.
How this pocket differs
notably more Punjabi speakers than Port Coquitlam 3% vs 1.6%
more Korean speakers than Port Coquitlam 3.7% vs 2.6%
Median household income is higher than Metro Vancouver $112,000 vs $90,000
Source: Statistics Canada, Census of Population, 2021. Reproduced and distributed on an "as is" basis with the permission of Statistics Canada.
Recent nearby sales
Sold prices are available to registered users. Log in to see what these sold for.

 1 / 40 photos