
 1 / 40 photos


















About This Property
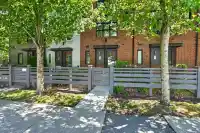
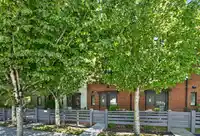
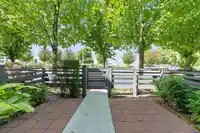
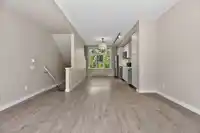
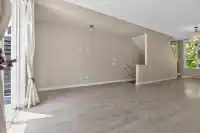
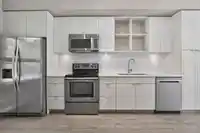
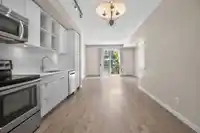
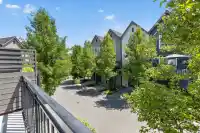
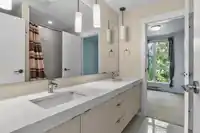
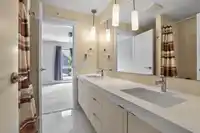
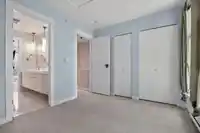
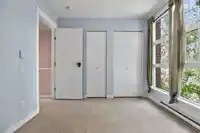
Contemporary townhomes at FREMONT BLUE by Mosaic. Enjoy this professionally measured 1078 sqft home in a live-work play neighborhood on the shores of Pitt River adjacent to Fremont Village & 25km of walking, running, and cycling on the Traboulay Trails. Open floor plan with a sleek, large kitchen featuring stainless steel appliances, a good-sized deck, two…
Features
Property Details
School Catchment
Neighbourhood
Age
- Under 1517.8%
- 15 to 6468.8%
- 65 and over13.4%
Household size
- 1 person19%
- 232.8%
- 321.8%
- 418.3%
- 5 or more8.2%
Language spoken at home
62.8% English mother tongue
Mother tongue, share of 5,730 residents.
How this pocket differs
- notably more Punjabi speakers than Port Coquitlam 3% vs 1.6%
- more Korean speakers than Port Coquitlam 3.7% vs 2.6%
- Median household income is higher than Metro Vancouver $112,000 vs $90,000
Source: Statistics Canada, Census of Population, 2021. Reproduced and distributed on an "as is" basis with the permission of Statistics Canada.
Recent nearby sales
Sold prices are available to registered users. Log in to see what these sold for.
Monthly Cost Calculator
An estimate only. Canadian semi-annual compounding; excludes utilities, closing costs and BC property transfer tax. 5-year fixed, as of Sep 3
Similar Listings Nearby
57 2380 RANGER LANE
27 2380 RANGER LANE
136 2418 AVON PLACE
48 2423 AVON PLACE
36 2927 FREMONT STREET
10 2927 FREMONT STREET
92 758 RIVERSIDE DRIVE
30 3127 SKEENA STREET
45 1255 RIVERSIDE DRIVE
16 1268 RIVERSIDE DRIVE
3 1370 RIVERWOOD GATE
32 1370 RIVERWOOD GATE BOULEVARD