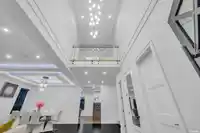
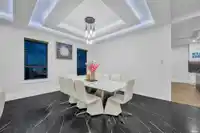
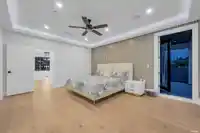
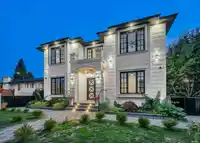
"WELCOME to 3 Level CUSTOM build 5200 sqft of luxury living!" 8BdRm / 9 Bath, 20 FT High ceilings greet as you enter. MAIN floor offers 1BdRm/full bath, Living & Dining, Modern kitchen with an oversized Island + covered patio with gas F/P for entertaining. UPSTAIRS 4BdRms & 4 Full Baths with shower jets, Master Bath HUGE 2 person jacuzzi. AC, Control 4…
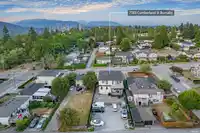
"WELCOME to 3 Level CUSTOM build 5200 sqft of luxury living!" 8BdRm / 9 Bath, 20 FT High ceilings greet as you enter. MAIN floor offers 1BdRm/full bath, Living & Dining, Modern kitchen with an oversized Island + covered patio with gas F/P for entertaining. UPSTAIRS 4BdRms & 4 Full Baths with shower jets, Master Bath HUGE 2 person jacuzzi. AC, Control 4 automation, Automated blinds, Radiant heat, LED light fixtures, CCTV Cameras, Built in wall vacuum, ceiling speakers, Name brand lighting, high end bathroom fixtures. Media Rm with separate entry. Self contained 2BdRm legal suite with laundry. Rear 7 Car parking on property. Steps to Cariboo Hill Secondary, 5 mins to shopping and Aquatic & Community Centre. Viewings by appt please call Raj S Grewal C: 778 888 6666.
Features
Central Vacuum
Balcony
Private Yard
Additional Parking
Open
Other
Front Access
Rear Access
Gravel
Shopping Nearby
Room measurements19 rooms▸
Porch (enclosed)Main · 5'7 × 8'2
Living RoomMain · 15'6 × 23'4
Dining RoomMain · 11'11 × 23'4
BedroomMain · 10'8 × 13'10
Family RoomMain · 16'10 × 17'7
KitchenMain · 16'10 × 13'5
Wok KitchenMain · 18'10 × 6'4
PatioMain · 9'8 × 17'3
Primary BedroomAbove · 16'10 × 14'1
BedroomAbove · 12'6 × 12'6
BedroomAbove · 11'3 × 13'11
BedroomAbove · 10'11 × 13'11
PatioAbove · 15'7 × 17'9
Recreation RoomBsmt · 18'7 × 17'5
DenBsmt · 8'10 × 8'11
BedroomBsmt · 11'2 × 9'3
BedroomBsmt · 10'9 × 13'2
PatioBsmt · 5'10 × 12'6
Living RoomBsmt · 7'10 × 13'2
Floor plan
🔍 Tap to zoom
Pinch or scroll to zoom · drag to pan · double-tap to reset
Property Details
MLS NumberR3157245
Property TypeSingle Family Residence
Bedrooms7
Bathrooms8.5
Square Feet5,162
Lot Size8,736 sqft
Year Built2022
HeatingHeat Pump, Radiant
Days on Market66
StatusActive
Listed BySutton Group - 1st West Realty
School Catchment
ElementaryEcole Armstrong
SecondaryCariboo Hill
Neighbourhood
Highlighted area = this home's census tract (StatCan), the boundary the neighbourhood stats describe.
$1,300,000Median home value
$106,000Median household income
67.7%Owner-occupied
34.8%Single-detached homes
3Avg household size
42.8Median age
44.2%Bachelor's degree or higher (25-64)
53.5%Commute under 30 min
86.3%Drive to work
45.1%Foreign-born residents
7,263Neighbourhood population
Age
Under 1516.6%
15 to 6464%
65 and over19.4%
Household size
1 person16.3%
228.1%
320.3%
421.2%
5 or more14.1%
Language spoken at home
47.9% English mother tongue
Cantonese9.6%
Mandarin6.9%
English + other4.4%
Punjabi4.1%
Korean3.9%
Spanish1.9%
All others21.3%
Mother tongue, share of 7,005 residents.
How this pocket differs
fewer people living alone than Burnaby East 16.3% vs 21.5%
more 4-person households than Burnaby East 21.2% vs 16.8%
notably more Korean speakers than Burnaby East 3.9% vs 2.2%
notably fewer Mandarin speakers than Burnaby East 6.9% vs 10.4%
Median dwelling value is higher than Metro Vancouver $1,300,000 vs $1,050,000
Source: Statistics Canada, Census of Population, 2021. Reproduced and distributed on an "as is" basis with the permission of Statistics Canada.
Land & Development
Lot size8,754 sqft
Lot dimensions52 × 168 ft
Lot shapeRectangular
Approximate lot lines (ParcelMap BC)
Zoning, lot dimensions and grade are approximate, from public data, and for reference only — verify with the City / Township of Langley before relying on them.
Recent nearby sales
Sold prices are available to registered users. Log in to see what these sold for.

 1 / 19 photos