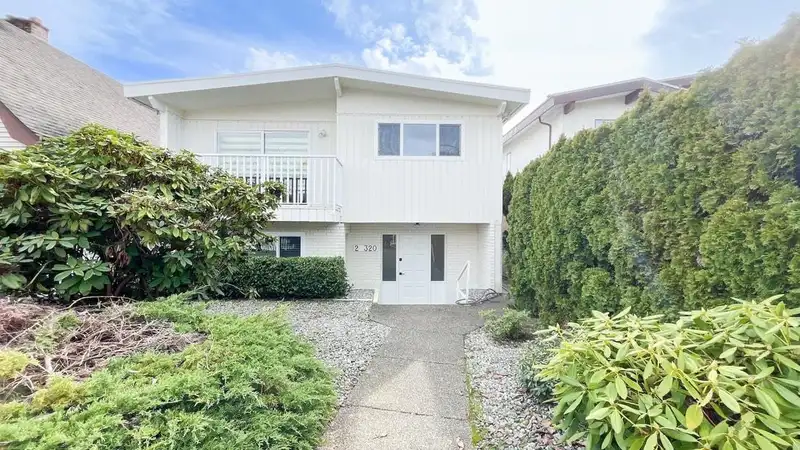
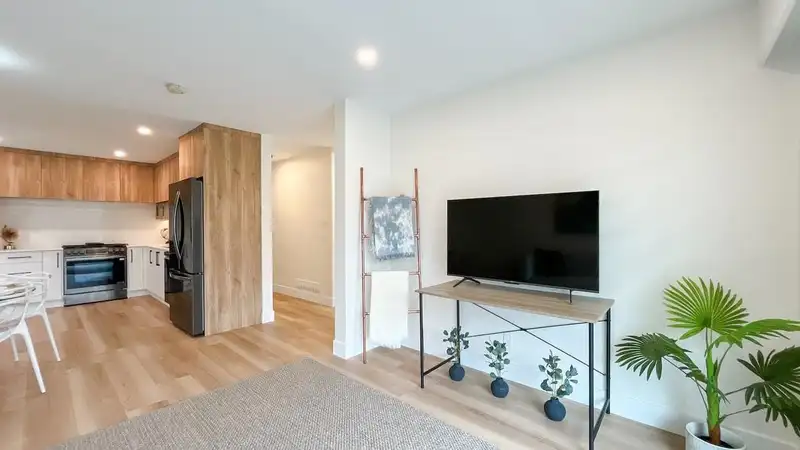
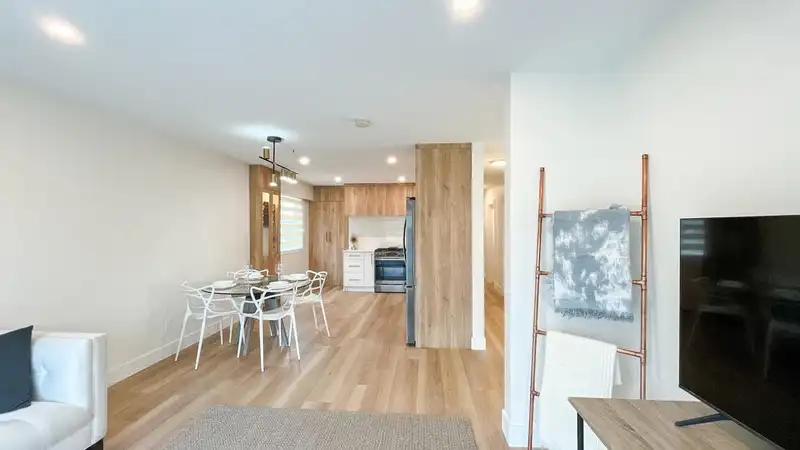
You have to see this house inside!!! Beautifully remodeled this charming house has everything that your heart desires. 4 bdrms up with 3 bathwhich is very rare for Vancouver Specials and fully renovated LEGAL 3 bdrm suite in the basement .This air-conditioned home features new windows ,new gutters,new kitchen,new appliances. New tankless hot water tank and…
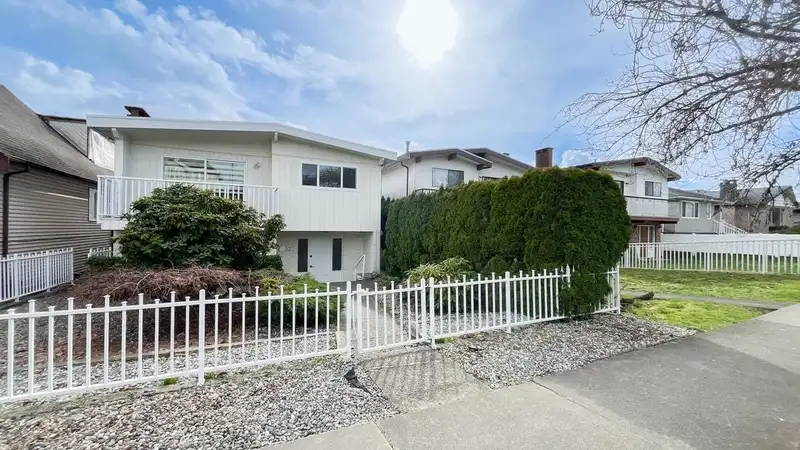
You have to see this house inside!!! Beautifully remodeled this charming house has everything that your heart desires. 4 bdrms up with 3 bathwhich is very rare for Vancouver Specials and fully renovated LEGAL 3 bdrm suite in the basement .This air-conditioned home features new windows ,new gutters,new kitchen,new appliances. New tankless hot water tank and furnace. Spacious main floor offers open plan with gorgeous kitchen and beautiful new floors perfect to host family and friends. The sundeck in the back is covered and can be used for many different purposes.1 covered carpot .Plans are available for renovations with the permits. Minutes away from Langara, golf course, community centre, transit, schools and restaurants.
Features
Pantry
Balcony
Room measurements15 rooms▸
Living RoomAbove · 13'2 × 9'4
Dining RoomAbove · 5'7 × 11'8
KitchenAbove · 11'3 × 12'7
LaundryAbove · 5'7 × 8'1
Primary BedroomAbove · 10'3 × 12'10
BedroomAbove · 11'3 × 10'2
BedroomAbove · 12' × 10'3
BedroomAbove · 10'4 × 10'
OtherAbove · 9'8 × 13'
BedroomBelow · 12'3 × 15'11
KitchenBelow · 9' × 16'4
Dining RoomBelow · 4'10 × 12'3
BedroomBelow · 7'11 × 12'
BedroomBelow · 11'6 × 11'3
FoyerBelow · 8'3 × 11'11
Floor plan
🔍 Tap to zoom
Pinch or scroll to zoom · drag to pan · double-tap to reset
Property Details
MLS NumberR3119423
Property TypeSingle Family Residence
Bedrooms7
Bathrooms2
Square Feet2,307
Lot Size3,692 sqft
Year Built1968
Parking Spaces1
HeatingElectric, Forced Air
StatusClosed
Listed BySutton Group-West Coast Realty
School Catchment
ElementaryHenderson
SecondaryJohn Oliver
Neighbourhood
Highlighted area = this home's census tract (StatCan), the boundary the neighbourhood stats describe.
$1,600,000Median home value
$90,000Median household income
52.4%Owner-occupied
15.4%Single-detached homes
3.1Avg household size
38.8Median age
40.2%Bachelor's degree or higher (25-64)
53.1%Commute under 30 min
64.6%Drive to work
57.4%Foreign-born residents
5,548Neighbourhood population
Age
Under 1512.2%
15 to 6471.2%
65 and over16.7%
Household size
1 person20.4%
222.6%
318.7%
419.8%
5 or more18.4%
Language spoken at home
26.1% English mother tongue
Punjabi22.3%
Tagalog10.4%
Cantonese9.7%
English + other8.1%
Mandarin3.3%
Hindi3.1%
All others17%
Mother tongue, share of 5,540 residents.
How this pocket differs
fewer Cantonese speakers than South Vancouver 9.7% vs 13.5%
more Hindi speakers than South Vancouver 3.1% vs 2.3%
more Tagalog speakers than South Vancouver 10.4% vs 8.2%
Median dwelling value is notably higher than Metro Vancouver $1,600,000 vs $1,050,000
Source: Statistics Canada, Census of Population, 2021. Reproduced and distributed on an "as is" basis with the permission of Statistics Canada.
Land & Development
Lot size3,533 sqft
Lot dimensions33 × 111 ft
Lot shapeRectangular
Approximate lot lines (ParcelMap BC)
Zoning, lot dimensions and grade are approximate, from public data, and for reference only — verify with the City / Township of Langley before relying on them.
Recent nearby sales
Sold prices are available to registered users. Log in to see what these sold for.

 1 / 34 photos