
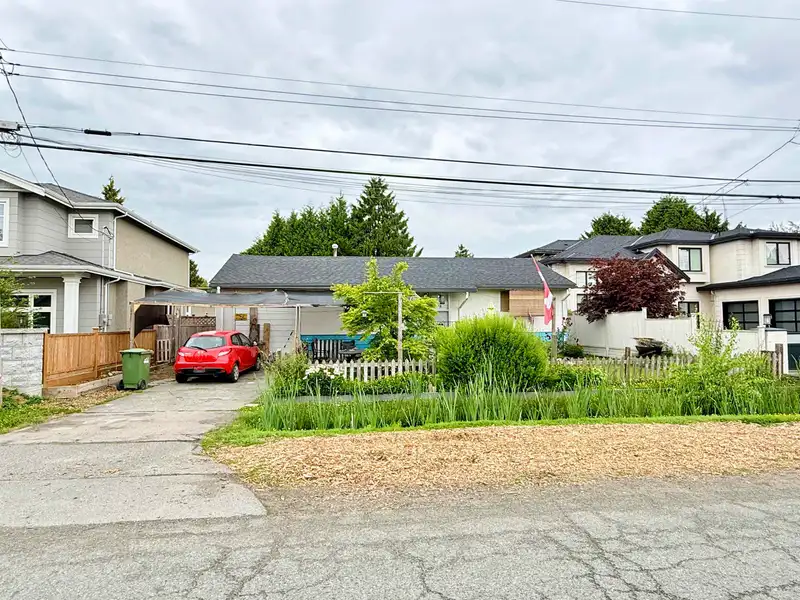
 1 / 18 photos
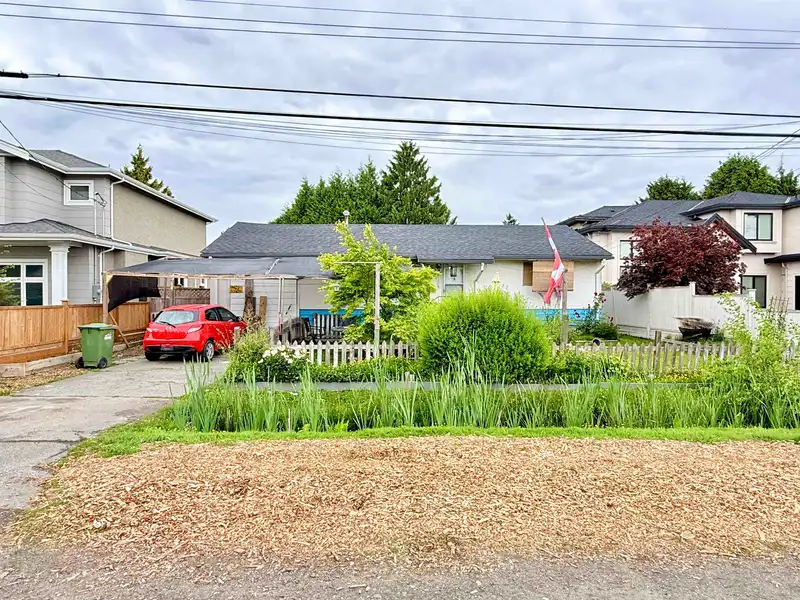
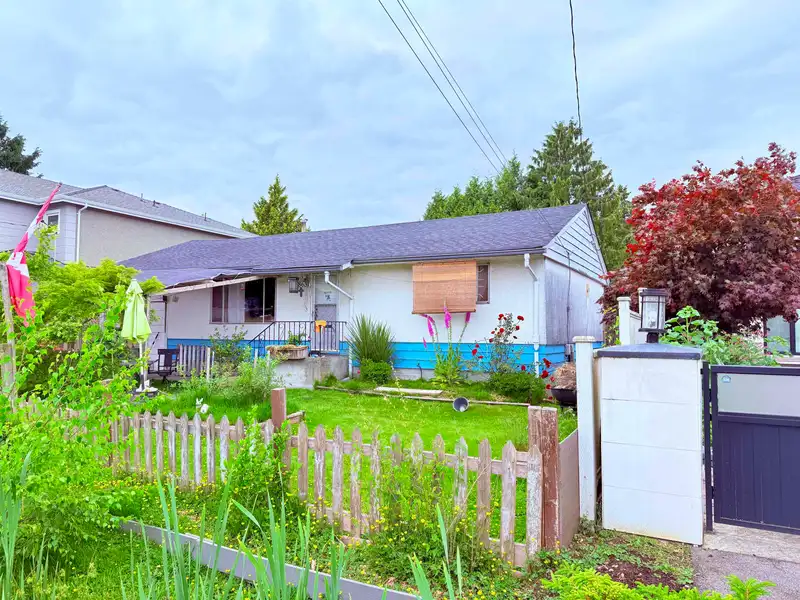
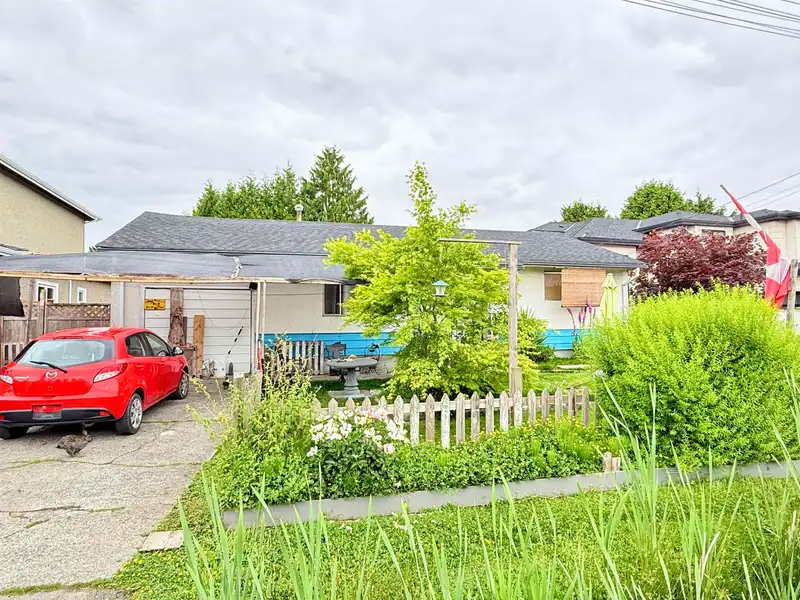


About This Property
FIRST TIME HOME BUYER / INVESTOR / DEVELOPER ALERT! This one-level home is in the true heart of Richmond, prime south-facing location, within walking distance to Lansdowne Mall, Central Mall at Garden City, famous Eat Street, Aberdeen Centre, Kwantlen Polytechnic University, and Canada Line SkyTrain. Short drive to YVR Airport and Downtown Vancouver.…
Property Details
School Catchment
Neighbourhood
Age
- Under 158.6%
- 15 to 6475.4%
- 65 and over16%
Household size
- 1 person39.1%
- 240.6%
- 312.6%
- 45.3%
- 5 or more2.4%
Language spoken at home
32.6% Mandarin mother tongue
Mother tongue, share of 6,965 residents.
How this pocket differs
- fewer children under 15 than West Cambie 8.6% vs 12%
- notably fewer 5+ person households than West Cambie 2.4% vs 6.1%
- notably fewer 4-person households than West Cambie 5.3% vs 9.7%
- more people living alone than West Cambie 39% vs 29.5%
- more Mandarin speakers than West Cambie 32.6% vs 24.7%
- Median household income is notably lower than Metro Vancouver $53,200 vs $90,000
- Median dwelling value is notably lower than Metro Vancouver $700,000 vs $1,050,000
Source: Statistics Canada, Census of Population, 2021. Reproduced and distributed on an "as is" basis with the permission of Statistics Canada.
Sales History
| Date | Sale Price |
|---|---|
| Jul 24, 2026 | $1,295,000 |
Source: BC Assessment (public records).
Land & Development
Within a provincially designated Transit-Oriented Area, this lot may support up to 3 FAR / 8 storeys regardless of base zoning. Provincial minimums and approximate — municipal rezoning, servicing and parking standards still apply.
Zoning, lot dimensions and grade are approximate, from public data, and for reference only — verify with the City / Township of Langley before relying on them.
Monthly Cost Calculator
An estimate only. Canadian semi-annual compounding; excludes utilities, closing costs and BC property transfer tax. 5-year fixed, as of Nov 9
Similar Listings Nearby
4540 NORTHEY ROAD
8331 BROWNELL ROAD
8251 LESLIE ROAD
3780 CUNNINGHAM DRIVE
9311 CUNNINGHAM PLACE
8371 SPIRES ROAD
8140 SPIRES ROAD
8864 COOK CRESCENT
8975 COOK CRESCENT
4131 FISHER DRIVE
10231 CAMBIE ROAD
10140 WESTMINSTER HIGHWAY