
 1 / 11 photos
About This Property
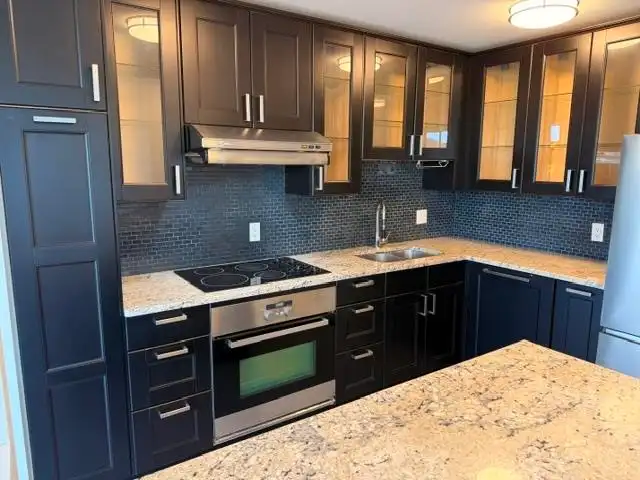
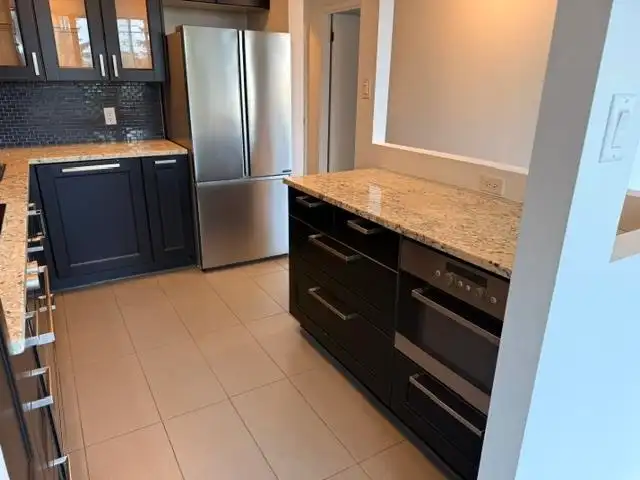
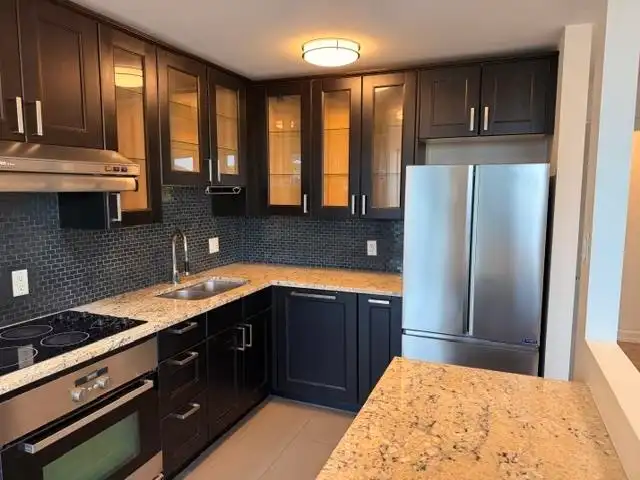
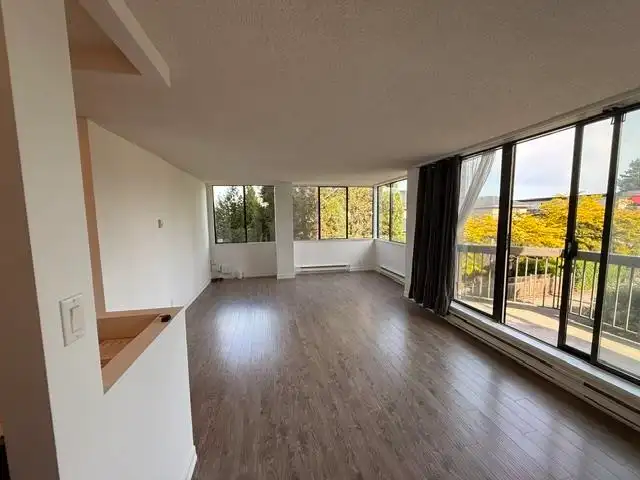
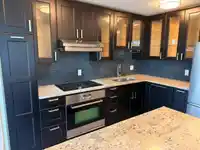
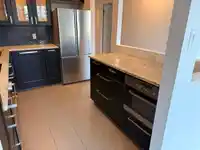
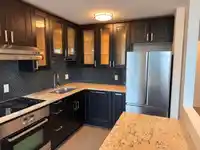
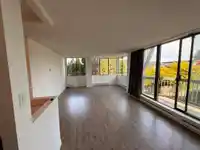
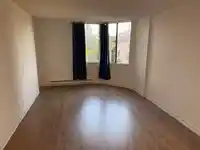
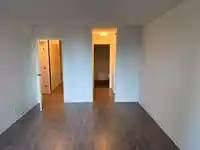
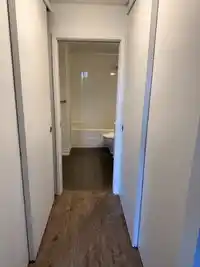
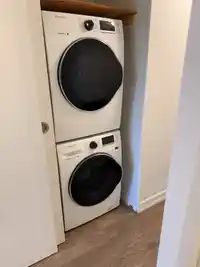
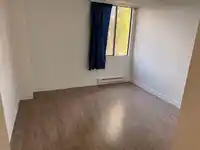
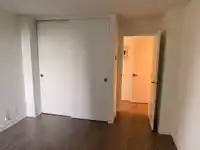
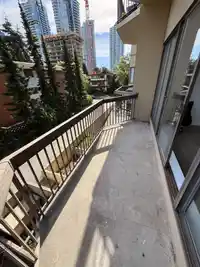
This South facing bright and spacious 2 bedroom, 1 bath room was renovated in 2015 and has been well maintained. An open concept design, a beautiful kitchen, stainless steel appliances, granite counter tops, tile flooring, beautiful backsplash and plenty of cabinets. Laminate floor and freshly painted throughout. Both bedrooms are large with a four piece…
Features
Property Details
School Catchment
Neighbourhood
Age
- Under 1511.5%
- 15 to 6478.1%
- 65 and over10.4%
Household size
- 1 person35.5%
- 236.3%
- 316.5%
- 48.7%
- 5 or more3.1%
Language spoken at home
23.5% English mother tongue
Mother tongue, share of 3,740 residents.
How this pocket differs
- notably fewer seniors 65+ than Metrotown 10.4% vs 16.9%
- fewer 5+ person households than Metrotown 3.1% vs 4.6%
- notably fewer Cantonese speakers than Metrotown 7.5% vs 11.3%
- more Spanish speakers than Metrotown 3.5% vs 2.4%
- Median household income is lower than Metro Vancouver $60,400 vs $90,000
- Median dwelling value is lower than Metro Vancouver $750,000 vs $1,050,000
Source: Statistics Canada, Census of Population, 2021. Reproduced and distributed on an "as is" basis with the permission of Statistics Canada.
Sales History
| Date | Sale Price |
|---|---|
| Jul 14, 2026 | $470,000 |
Source: BC Assessment (public records).
Recent nearby sales
Sold prices are available to registered users. Log in to see what these sold for.
Monthly Cost Calculator
An estimate only. Canadian semi-annual compounding; excludes utilities, closing costs and BC property transfer tax. 5-year fixed, as of Nov 10
Similar Listings Nearby
2102 6540 BURLINGTON AVENUE
1104 6540 BURLINGTON AVENUE
1903 6540 BURLINGTON AVENUE
2006 6540 BURLINGTON AVENUE
1401 6540 BURLINGTON AVENUE
307 5127 IRVING STREET
104 6388 MARLBOROUGH AVENUE
300 6388 MARLBOROUGH AVENUE
1408 6638 DUNBLANE AVENUE
1608 6638 DUNBLANE AVENUE
1607 6638 DUNBLANE AVENUE
1605 6700 DUNBLANE AVENUE