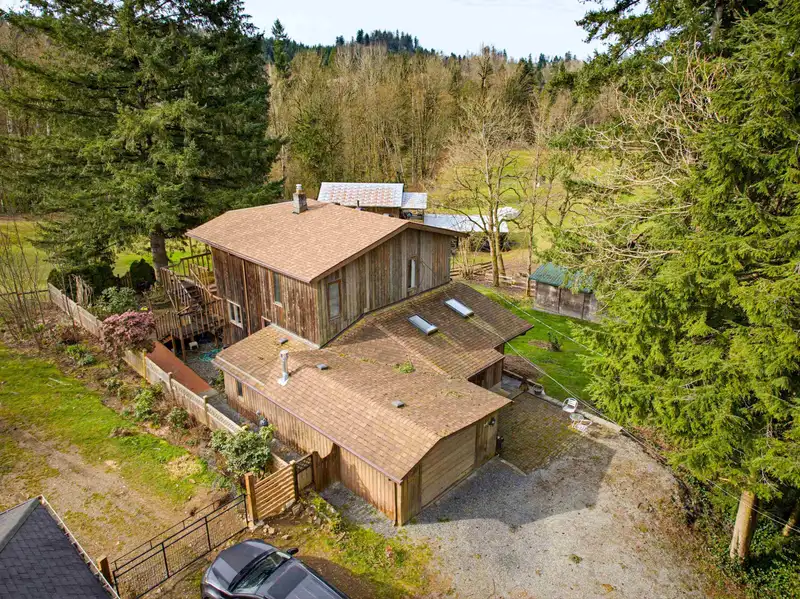
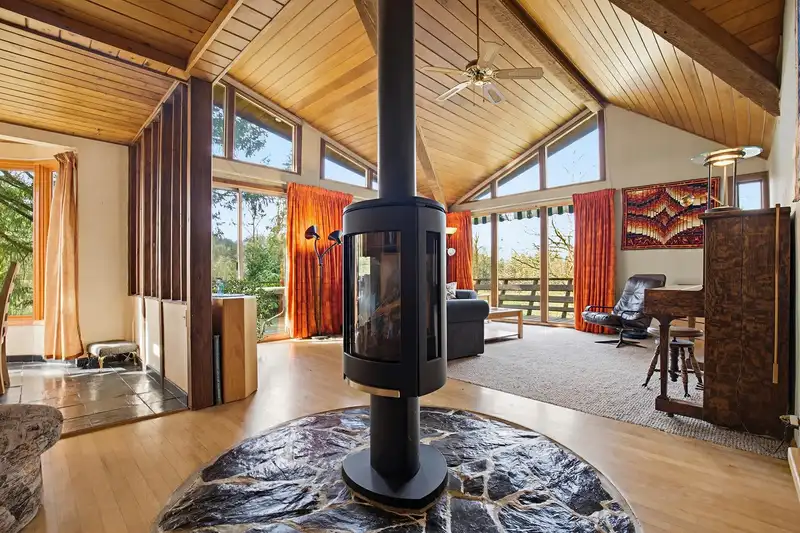
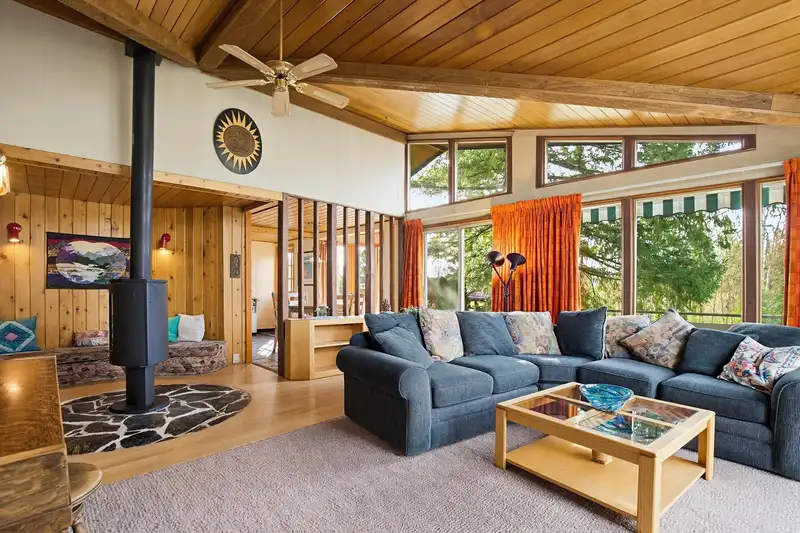
Set among surrounding acreages yet just 5 minutes to town, this distinctive home offers a rare blend of privacy and character. The main level is anchored by a striking great room with vaulted tongue & groove ceilings, oversized windows, and a Scandinavian-style gas fireplace. Slate floors run through the kitchen, which opens to a unique bar/lounge area…
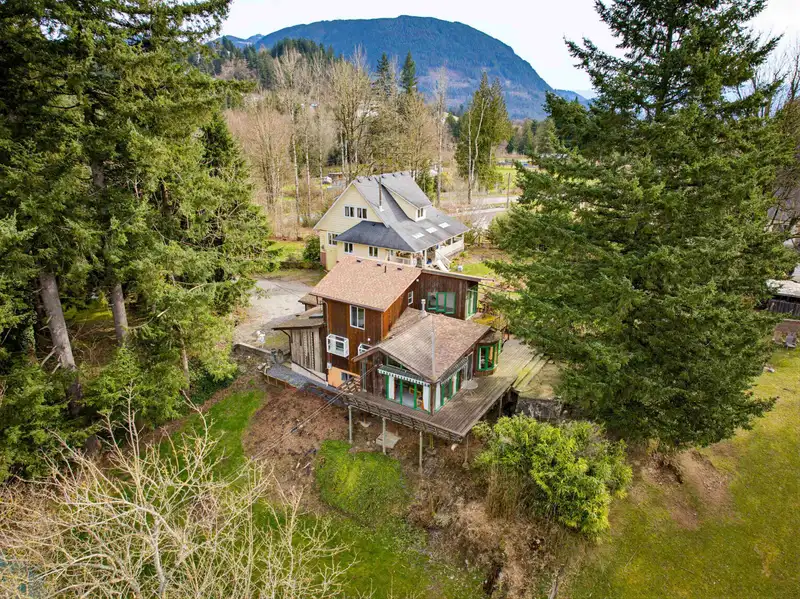
Set among surrounding acreages yet just 5 minutes to town, this distinctive home offers a rare blend of privacy and character. The main level is anchored by a striking great room with vaulted tongue & groove ceilings, oversized windows, and a Scandinavian-style gas fireplace. Slate floors run through the kitchen, which opens to a unique bar/lounge area designed for entertaining. Bedroom and full bath on the main. Upstairs, a spiral staircase leads to the primary suite with ensuite, loft, and access to an upper deck. .The finished lower level adds additional living space, laundry, and storage. Multiple decks and inviting spaces throughout. 37' x13' barn with pwer, concrete floor and a metal roof. Walk to Hatzic schools.The road is not labbeled. Number on the house is 8925 Draper.
Features
Balcony
Garage Single
Front Access
Room measurements13 rooms▸
FoyerMain · 3'4 × 6'4
Bar RoomMain · 12'10 × 13'7
KitchenMain · 8'1 × 11'
Dining RoomMain · 9'5 × 14'11
Great RoomMain · 16'3 × 21'1
BedroomMain · 10'4 × 10'10
DenMain · 12'5 × 7'4
LaundryBsmt · 10'1 × 10'7
BedroomBsmt · 10'6 × 10'7
StorageBsmt · 16'9 × 14'1
Primary BedroomAbove · 11'2 × 16'2
LoftAbove · 24'10 × 8'4
Walk-In ClosetAbove · 5'9 × 7'5
Floor plan
🔍 Tap to zoom
Pinch or scroll to zoom · drag to pan · double-tap to reset
Property Details
MLS NumberR3129092
Property TypeSingle Family Residence
Bedrooms3
Bathrooms2.5
Square Feet2,300
Lot Size9,600 sqft
Year Built1948
Parking Spaces1
HeatingForced Air
StatusClosed
Listed ByRoyal LePage - Wolstencroft
School Catchment
ElementaryHatzic Elementary
SecondaryMission Senior Secondary
Neighbourhood
Highlighted area = this home's census tract (StatCan), the boundary the neighbourhood stats describe.
$1,000,000Median home value
$123,000Median household income
83.8%Owner-occupied
74.7%Single-detached homes
3.4Avg household size
38.4Median age
16.3%Bachelor's degree or higher (25-64)
49.9%Commute under 30 min
94.7%Drive to work
19.6%Foreign-born residents
8,648Neighbourhood population
Age
Under 1520.3%
15 to 6466.6%
65 and over13.1%
Household size
1 person11.8%
226.9%
317.2%
419%
5 or more25.1%
Language spoken at home
76% English mother tongue
Punjabi14%
English + other2.1%
Spanish0.6%
Hindi0.5%
German0.5%
French0.5%
All others5.8%
Mother tongue, share of 8,295 residents.
How this pocket differs
notably fewer people living alone than Mission BC 11.8% vs 20.1%
notably more 5+ person households than Mission BC 25.1% vs 15.8%
notably more Punjabi speakers than Mission BC 14% vs 7.9%
Median household income is higher than Abbotsford-Mission $123,000 vs $91,000
Source: Statistics Canada, Census of Population, 2021. Reproduced and distributed on an "as is" basis with the permission of Statistics Canada.
Land & Development
Lot size338,820 sqft
Lot dimensions407 × 1320 ft
Lot shapeIrregular
Approximate lot lines (ParcelMap BC)
Zoning, lot dimensions and grade are approximate, from public data, and for reference only — verify with the City / Township of Langley before relying on them.
Recent nearby sales
Sold prices are available to registered users. Log in to see what these sold for.

 1 / 40 photos