
 1 / 40 photos

















About This Property
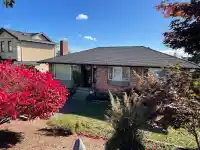
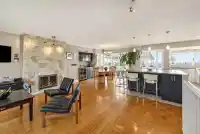
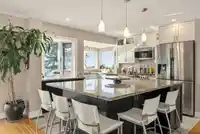
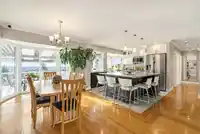
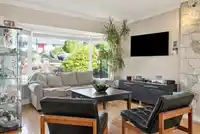
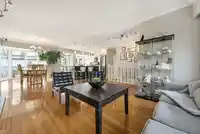
Beautiful Southern views (& W/E). See Sunrise all the way to Sunset & look at incredible views to Gulf Islands, S. Delta, White Rock, etc... Bright & spacious loved home on 60 x 122 lot w/lane. Main floor features large living room, dinrm, leading to large deck, bar area, open concept kitchen w/lots of cabinets, 5 x 7 Granite Island. View as soon as you…
Property Details
School Catchment
Neighbourhood
Age
- Under 1514%
- 15 to 6470.5%
- 65 and over15.5%
Household size
- 1 person23.5%
- 229.9%
- 320.4%
- 415.6%
- 5 or more10.6%
Language spoken at home
34.8% English mother tongue
Mother tongue, share of 7,505 residents.
How this pocket differs
- more children under 15 than Metrotown 14% vs 11%
- notably more 5+ person households than Metrotown 10.7% vs 4.6%
- notably more 4-person households than Metrotown 15.6% vs 9.2%
- fewer people living alone than Metrotown 23.6% vs 34.9%
- notably more Punjabi speakers than Metrotown 3.5% vs 1.6%
- more Cantonese speakers than Metrotown 14.4% vs 11.3%
Source: Statistics Canada, Census of Population, 2021. Reproduced and distributed on an "as is" basis with the permission of Statistics Canada.
Land & Development
Zoning, lot dimensions and grade are approximate, from public data, and for reference only — verify with the City / Township of Langley before relying on them.
Recent nearby sales
Sold prices are available to registered users. Log in to see what these sold for.
Monthly Cost Calculator
An estimate only. Canadian semi-annual compounding; excludes utilities, closing costs and BC property transfer tax. 5-year fixed, as of Oct 26
Similar Listings Nearby
5529 KEITH STREET
5410 PATRICK STREET
5399 CARSON STREET
5511 MCKEE STREET
5463 PORTLAND STREET
5343 NEVILLE STREET
SF 5915 KEITH STREET
5941 CARSON STREET
5105 MCKEE STREET
5957 MCKEE STREET
8061 MCGREGOR AVENUE
8656 GILLEY AVENUE