
 1 / 40 photos


















About This Property
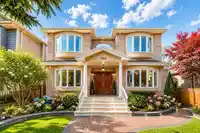
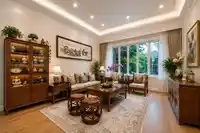
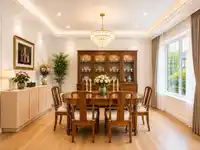
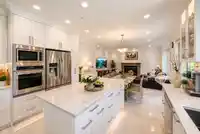
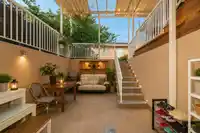
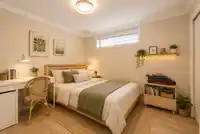
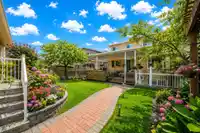
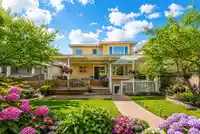
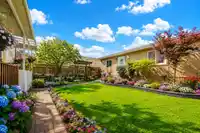
Renovated! Custom-Built Luxury Home in Prime Location. Immaculate home on a beautiful cherry blossom-lined street! Sitting on a 43x138 ft (5,950 SF) lot, it offers over 3,500 SF of living space with 5 bedrooms and 4 full bathrooms, including a main-floor bedroom and bath — perfect for guests or extended family. Features include a gourmet kitchen with custom…
Property Details
School Catchment
Neighbourhood
Age
- Under 1511.5%
- 15 to 6468.6%
- 65 and over19.9%
Household size
- 1 person29.3%
- 229.9%
- 316.6%
- 414.6%
- 5 or more9.5%
Language spoken at home
31.8% English mother tongue
Mother tongue, share of 5,795 residents.
How this pocket differs
- notably more 5+ person households than Marpole 9.5% vs 5.9%
- more 4-person households than Marpole 14.6% vs 10%
- fewer people living alone than Marpole 29.2% vs 39.4%
- notably fewer Tagalog speakers than Marpole 3% vs 4.6%
- more Cantonese speakers than Marpole 22.2% vs 16.4%
- Median dwelling value is notably higher than Metro Vancouver $2,000,000 vs $1,050,000
Source: Statistics Canada, Census of Population, 2021. Reproduced and distributed on an "as is" basis with the permission of Statistics Canada.
Land & Development
Within a provincially designated Transit-Oriented Area, this lot may support up to 3 FAR / 8 storeys regardless of base zoning. Provincial minimums and approximate — municipal rezoning, servicing and parking standards still apply.
Zoning, lot dimensions and grade are approximate, from public data, and for reference only — verify with the City / Township of Langley before relying on them.
Recent nearby sales
Sold prices are available to registered users. Log in to see what these sold for.
Monthly Cost Calculator
An estimate only. Canadian semi-annual compounding; excludes utilities, closing costs and BC property transfer tax. 5-year fixed, as of Nov 12
Similar Listings Nearby
596 W 62ND AVENUE
725 W 61ST AVENUE
580 W 64TH AVENUE
8221 FREMLIN STREET
7658 FREMLIN STREET
515 W 60TH AVENUE
7649 YUKON STREET
792 W 54TH AVENUE
8110 OSLER STREET
1076 PARK DRIVE
1041 W 58TH AVENUE
735 W 54TH AVENUE